What’s Brewing? America’s Most Coffee-Loving States
We analyzed search trends across America to find the states that love coffee most, each state’s favorite coffee shop, and where pumpkin spice season is heating up fastest.

Coffee is less of a drink for many Americans than a daily ritual. It’s there first thing in the morning, during the afternoon slump, on the drive to work, and sometimes after dinner when tomorrow’s sleep schedule can deal with the consequences.
And we drink a lot of it. About two-thirds of American adults drink coffee on any given day, averaging 2.8 cups apiece.1 In a typical week, nearly 195 million American adults reach for coffee at least once.2
But America’s coffee habit doesn’t look the same everywhere. Some of us swear by the neighborhood coffee shop, others remain fiercely loyal to a favorite chain, and plenty prefer brewing their own at home. So we started wondering: Where does coffee culture run deepest? Which coffee shops have claimed different parts of the country? And with the annual pumpkin spice onslaught upon us, where is fall arriving in a coffee cup first?
To find out, we analyzed search trends across all 50 states and Washington, D.C., looking at overall coffee interest, each state’s go-to coffee shop, and where pumpkin spice latte enthusiasm is heating up as summer winds down.
Here’s where America’s coffee obsession runs strongest — and what everyone is drinking.
Jump to:
Key takeaways
- Kansas is America’s coffee capital, narrowly beating California for the top spot. Who would have guessed? The Sunflower State out-searches California — and every other state — when it comes to coffee.
- New York comes in third, followed by Massachusetts and Illinois. The state that’s home to the city that never sleeps apparently has plenty of coffee to help keep it that way.
- Some of America’s most famous coffee territory finishes a little farther down the list than expected. Washington ranks seventh despite Seattle’s legendary coffee culture, while Oregon just misses the top 10 at No. 11. Around our office, both were front-runners for the top spot before we crunched the numbers.
- Pumpkin spice season starts while summer is still very much happening. Five years of search history show interest in pumpkin spice lattes peaking in August. This year, Arizona leads the country in enthusiasm for pumpkin spice lattes, followed by Colorado and Kentucky. Based on our 5-year analysis, Colorado is deeply interested in the beverage every year. California comes in fourth, while South Carolina and Florida also rank near the top. Apparently, neither desert heat nor the calendar can stop fall from arriving in a coffee cup.
- Starbucks still dominates America’s coffee-shop landscape. The Seattle-born giant is the top-searched coffee chain in 21 states plus Washington, D.C. — more than twice as many jurisdictions as any other brand.
- Dunkin’ owns the Northeast. Ten states choose Dunkin’ — Connecticut, Delaware, Maine, Massachusetts, New Hampshire, New Jersey, New York, Pennsylvania, Rhode Island, and Vermont — creating a remarkably tight regional stronghold. That’s less a cluster than a territory.
- Several coffee chains are strongest close to home. California chooses San Francisco-born Philz, Oregon picks Grants Pass-born Dutch Bros, Minnesota favors Edina-born Caribou, Nebraska chooses Bellevue-born Scooter’s, Louisiana goes with New Orleans-born PJ’s, and Arkansas picks Rogers-born 7 Brew. Coffee chains can travel, but home-field advantage apparently still counts.
- 7 Brew is the new kid with a surprisingly large piece of the map. Founded in Arkansas in 2017, the drive-thru chain already wins six states: Alabama, Arkansas, Kentucky, Mississippi, Missouri, and Oklahoma. All six form a remarkably tidy South-central coffee belt.
- Mississippi finishes last — twice. The Magnolia State ranks 51st in overall coffee interest and also dead last for pumpkin spice latte enthusiasm as the season gets underway. Maybe all that sweet tea is tough competition.
States that love coffee the most (and least)

Image by Innerbody Research
Kansas takes the top spot in our coffee rankings, but just barely. Its Search Interest Index of 95.0 edges California’s 94.8 by only two-tenths of a point. After that, there’s daylight: New York comes in third at 77.5, followed by Massachusetts and Illinois.
Here are the top 10 states and jurisdictions for overall coffee search interest:
- Kansas
- California
- New York
- Massachusetts
- Illinois
- District of Columbia
- Washington
- Florida
- Arizona
- Colorado
Kansas is probably not the state most people would pick as America’s coffee capital. Seattle has the reputation. California has a famously developed café scene. New York City practically runs on coffee. But our underlying search data suggests Kansas earns its spot in a different way: people there show unusually strong interest in making coffee themselves.
Kansas ranks at or near the top for searches involving coffee grinders, coffee makers, espresso beans, and how to make a latte. In other words, some of the state’s strongest coffee interest appears to be happening at the kitchen counter rather than the café counter.
That actually fits a much broader American habit. According to the National Coffee Association, 82% of people who drank coffee in the past day had coffee prepared at home, compared with 28% who had coffee prepared away from home.2 Kansas may simply be taking America’s home-brewing habit more seriously than the rest of us.
California’s second-place finish may have a different story behind it. The state helped shape modern American specialty coffee culture decades before cold foam and five-word drink orders became commonplace. According to the UC Davis Library, many of the defining characteristics of coffee’s “second wave” — when the focus shifted from mass-market coffee toward higher-quality beans, roasting, and café culture — emerged in the San Francisco Bay Area. Alfred Peet opened Peet’s Coffee in Berkeley in 1966, introducing darker roasts and a more artisanal approach to coffee, while San Francisco coffee importer Erna Knutsen is credited with popularizing the term “specialty coffee” in the 1970s.3
That influence eventually traveled north. The founders of Starbucks learned about roasting and the coffee business from Peet before opening their first Seattle shop in 1971.4
Which makes another result all the more interesting.
What else is brewing near the top?
Washington ranks seventh despite Seattle’s legendary coffee culture, and Oregon lands just outside the top ten at No. 11. For a region practically synonymous with coffee culture, that’s a surprisingly modest showing.
And Seattle’s reputation is well deserved. Commercial coffee roasting there dates to the 1800s, espresso-oriented coffeehouses emerged by the late 1950s and 1960s, and the city eventually produced Starbucks, Seattle’s Best Coffee, Espresso Vivace, and a host of innovations in espresso equipment.4
But our rankings aren’t measuring which state has the richest coffee history or the most famous cafés. They reflect search interest across a broad range of coffee topics — from shops and chains to brewing equipment, beans, drink styles, and preparation. By that measure, Washington still performs extremely well. It just doesn’t own the category.
Massachusetts, meanwhile, has its own claim to specialty-coffee history. George Howell opened Coffee Connection in Cambridge in 1975 as part of the same specialty movement that was developing on the West Coast.3 Its fourth-place finish suggests America's coffee story was never exclusively a Seattle one.
The geography at the top is surprisingly scattered overall. The top ten stretches from California and Washington to New York and Massachusetts, with Kansas and Illinois in the middle and Florida farther south. There really isn’t one American “coffee belt.”
Now for the other end of the coffee pot.
Who loves coffee the least, based on our study?
Here are the ten states with the lowest overall coffee search interest:
- Mississippi
- Utah
- Arkansas
- Wyoming
- Maryland
- West Virginia
- New Mexico
- Montana
- Iowa
- Indiana
The bottom of the rankings is just as geographically scattered as the top. The 10 lowest-ranking states stretch from Mississippi and Arkansas in the South to Wyoming and Montana in the Mountain West, with Iowa and Indiana in the Midwest and Maryland on the East Coast.
But Maryland produces perhaps the strangest geographic contrast in the entire ranking. Washington, D.C., comes in sixth, while its next-door neighbor falls all the way to 47th. Sometimes crossing a border apparently changes more than the license plates.
Utah’s 50th-place finish is a little easier to understand. About half of adults in the state identify as members of The Church of Jesus Christ of Latter-day Saints, according to Pew Research Center.5 The church’s Word of Wisdom calls on members to abstain from coffee and tea, a practice that has been firmly established for more than a century.6 So with coffee off the menu for such a large share of the population, Utah’s spot near the bottom isn’t all that surprising.
Then there’s Mississippi.
The Magnolia State ranks last overall with a Search Interest Index of just 5.49 — less than one-sixteenth of Kansas’s score.
Coffee also has some stiff competition in this part of the country: sweet tea. Mississippi State University describes sweet tea as a longtime Southern staple, and research in the Lower Mississippi Delta has documented substantial sweet-tea consumption among adults in the region.7 8 Maybe Mississippi just likes its caffeine a little sweeter.
The full results
Curious where your state ranks? Here’s how all 50 states and Washington, D.C., rank for overall coffee search interest:
| Ranking | State | Search Interest Index |
|---|---|---|
| 1 | Kansas | 95.00 |
| 2 | California | 94.80 |
| 3 | New York | 77.53 |
| 4 | Massachusetts | 69.35 |
| 5 | Illinois | 67.53 |
| 6 | District of Columbia | 65.26 |
| 7 | Washington | 63.82 |
| 8 | Florida | 63.16 |
| 9 | Arizona | 60.57 |
| 10 | Colorado | 58.14 |
| 11 | Oregon | 58.08 |
| 12 | Pennsylvania | 53.36 |
| 13 | Virginia | 51.69 |
| 14 | Nevada | 51.55 |
| 15 | Connecticut | 51.03 |
| 16 | Hawaii | 50.51 |
| 17 | Rhode Island | 49.98 |
| 18 | New Jersey | 49.69 |
| 19 | Delaware | 47.90 |
| 20 | Tennessee | 42.92 |
| 21 | South Carolina | 42.17 |
| 22 | Texas | 40.45 |
| 23 | Ohio | 39.00 |
| 24 | North Carolina | 37.93 |
| 25 | New Hampshire | 36.37 |
| 26 | Michigan | 35.69 |
| 27 | Minnesota | 35.38 |
| 28 | North Dakota | 33.55 |
| 29 | Wisconsin | 33.06 |
| 30 | Vermont | 31.87 |
| 31 | Missouri | 31.77 |
| 32 | Georgia | 31.16 |
| 33 | Kentucky | 29.46 |
| 34 | Idaho | 28.07 |
| 35 | Nebraska | 26.25 |
| 36 | Alaska | 25.67 |
| 37 | Louisiana | 24.60 |
| 38 | South Dakota | 23.72 |
| 39 | Alabama | 23.49 |
| 40 | Maine | 22.93 |
| 41 | Oklahoma | 22.09 |
| 42 | Indiana | 22.07 |
| 43 | Iowa | 20.45 |
| 44 | Montana | 19.55 |
| 45 | New Mexico | 18.28 |
| 46 | West Virginia | 17.82 |
| 47 | Maryland | 16.35 |
| 48 | Wyoming | 11.41 |
| 49 | Arkansas | 8.69 |
| 50 | Utah | 6.66 |
| 51 | Mississippi | 5.49 |
America’s go-to coffee shops by state
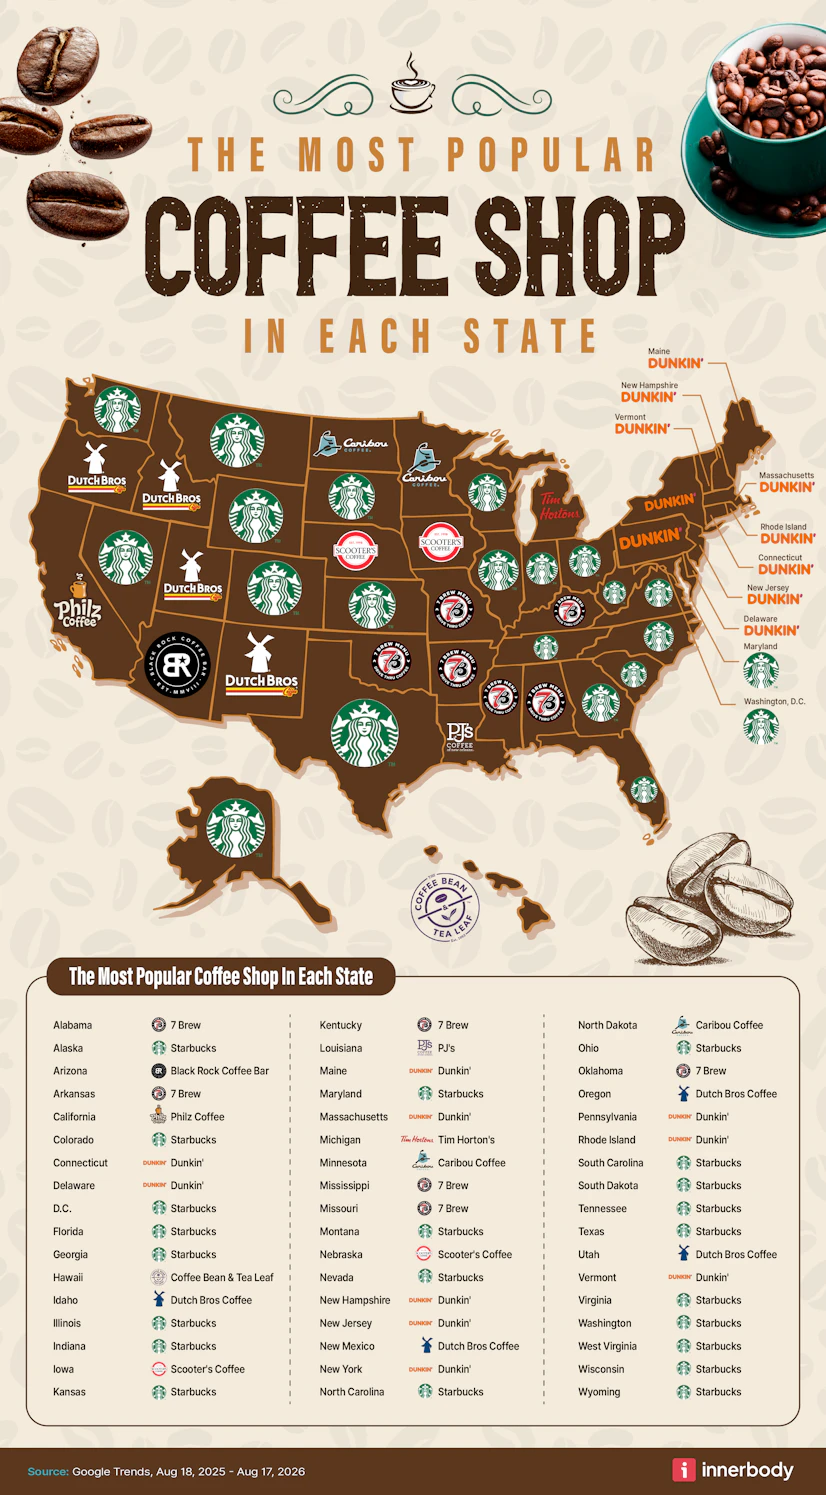
Image by Innerbody Research
America may have thousands of independent coffee shops, but when it comes to the chains people search for most, the map quickly turns into a battle between one national giant and a collection of strong regional favorites.
Starbucks has by far the largest footprint in our results. The Seattle-born chain comes out on top in 21 states plus Washington, D.C., stretching from Washington and Colorado to Florida, Texas, Virginia, and the Carolinas. More than 50 years after opening its first store in Seattle’s Pike Place Market in 1971, Starbucks has become about as national as a coffee brand can get.
But it doesn’t own the whole map. In fact, some of the clearest patterns appear where Starbucks doesn’t win.
Dunkin’ owns the Northeast
No brand has a cleaner regional stronghold than Dunkin’. It wins 10 states — Connecticut, Delaware, Maine, Massachusetts, New Hampshire, New Jersey, New York, Pennsylvania, Rhode Island, and Vermont — forming a tight Northeast and Mid-Atlantic stronghold.
That territory starts close to home. Dunkin’ was founded in Quincy, Massachusetts, in 1950, and its footprint remains unusually dense there. And despite the donuts in its original name, coffee has been part of the formula from the beginning. Founder William Rosenberg’s original shop sold coffee alongside donuts in 1948, and the beverage eventually became important enough to the brand that Dunkin’ dropped “Donuts” from its name in 2019.
Today, Massachusetts has more than 1,000 Dunkin’ locations, while New York, New Jersey, Pennsylvania, and Connecticut are also among the states with the chain’s largest store counts.9
So Dunkin’s sweep across the region isn’t merely a quirky search pattern. Generations of Northeast residents have grown up with the chain practically around the corner. At this point, Dunkin’ may be less a regional coffee preference than a piece of regional infrastructure.
The home team still matters
Some of the most satisfying results on the map are the states sticking with brands that got their start close to home:
- California chooses Philz Coffee, whose first dedicated coffee shop opened in San Francisco’s Mission District in 2003.
- Oregon picks Dutch Bros, which began with a pushcart and espresso machine in Grants Pass in 1992.
- Minnesota favors Caribou Coffee, founded with its first shop in Edina in 1992.
- Nebraska chooses Scooter’s Coffee, which opened its first drive-thru in Bellevue in 1998.
- Louisiana goes with PJ’s Coffee, a New Orleans original founded in 1978.
- Arkansas picks 7 Brew, founded in Northwest Arkansas in 2017.
Some of those loyalties are backed by formidable local footprints. Caribou, for example, currently lists about 290 Minnesota locations — roughly 60% of its entire U.S. store base. Coffee chains can travel, but home-field advantage apparently still counts.
7 Brew is building a territory of its own
One of the youngest brands on the map also has one of its clearest geographic clusters. 7 Brew wins Alabama, Arkansas, Kentucky, Mississippi, Missouri, and Oklahoma — six states grouped across the South and central U.S. That’s an impressive showing for a company founded less than a decade ago.
Since getting its start in Arkansas in 2017, 7 Brew has expanded quickly. The chain had only seven stands by 2020; today, the company reports more than 800 stands across 38 states.10 Its drive-thru-only model also resembles another fast-growing regional player, Dutch Bros, suggesting that America’s next coffee battle may increasingly be fought from the driver’s seat.
Arizona gives an Oregon brand a new home
Not every regional favorite stays loyal to its birthplace.
Arizona chooses Black Rock Coffee Bar, even though the chain was founded in Beaverton, Oregon, in 2008. That looks a little strange until you look at where Black Rock has grown.
As of mid-2025, the company operated 52 locations in Arizona compared with 34 in Oregon, and its corporate headquarters is now in Scottsdale. Meanwhile, Oregon gives its vote to another homegrown chain, Dutch Bros.
So Black Rock may have been born in Oregon, but Arizona has become one of its most important homes.
And Michigan looks north
Michigan is the only state on our map where Tim Hortons comes out on top.
That feels geographically appropriate. Tim Hortons opened its first restaurant in Hamilton, Ontario, in 1964, and Michigan sits directly across the border from the Canadian province. In a map otherwise dominated by American-born chains, Michigan apparently isn’t afraid to cross an international border for its coffee allegiance. Of course, there’s no need to cross a border now that Tim Hortons has opened hundreds of locations throughout the Great Lakes states and the Northeast.
Taken together, the map shows just how regional American coffee loyalty remains. Starbucks may dominate nationally, but move from one part of the country to another and the landscape changes quickly.
Where pumpkin spice season is heating up

Image by Innerbody Research
Arizona is apparently ready for fall, even if the weather isn’t.
The state has the highest pumpkin spice latte search interest in our analysis, followed by Colorado and Kentucky. California ranks fourth, with Illinois, Ohio, and Virginia rounding out the top seven.
Here are the 10 places showing the most pumpkin spice latte interest:
- Arizona
- Colorado
- Kentucky
- California
- Ohio
- Virginia
- Illinois
- Indiana
- Wisconsin
- Missouri
Arizona taking the top spot is hard not to appreciate. Phoenix’s normal high hovers around 104°F in August, according to NOAA climate normals.11 Nothing says sweater weather quite like triple digits.
And Arizona isn’t the only warm-weather state getting an early start. California ranks fourth, South Carolina 11th, and Florida 12th. Pumpkin spice, it seems, is less dependent on actual fall weather than on deciding you’ve had enough of summer.
There is a geographic pattern farther down the top 10, though. Ohio, Illinois, Indiana, Wisconsin, and Missouri all rank among the leaders, giving the Midwest a particularly strong showing as pumpkin spice season ramps up.
Perhaps more surprising is what happens in New England. The part of the country practically synonymous with fall foliage isn’t leading the pumpkin spice charge. Massachusetts ranks 25th, New Hampshire 33rd, Rhode Island 44th, Maine 46th, and Vermont 48th.
Mississippi, meanwhile, finishes 51st — just as it does in our overall coffee rankings. Its pumpkin spice latte search interest is less than one-quarter of Arizona’s. Whatever seasonal spell pumpkin spice has cast over the rest of the country, Mississippi seems relatively immune.
Why pumpkin spice season starts in August
Five years of Google Trends data show a remarkably consistent pattern: searches for “pumpkin spice latte” peak in August each year. That may seem early for a drink synonymous with fall, but the timing makes more sense when you look at when pumpkin spice lattes actually return.
Major coffee chains now bring their fall drinks back before summer is over. This year, Dunkin’ brought its fall menu — including its Pumpkin Spice Signature Latte — back on August 19, while Starbucks’ Pumpkin Spice Latte returned August 25. So at least some of that August search activity likely comes from people anticipating their favorite fall drinks and checking when they can order one.
The flavors themselves, of course, have been signaling fall for much longer. Pumpkin pie recipes seasoned with ginger, nutmeg, mace, and allspice appeared in American Cookery, the first known American cookbook, published in 1796.12 By 1934, McCormick had made the combination even easier with its premixed pumpkin pie spice.13
It took coffee, however, to turn pumpkin spice into the cultural phenomenon we know today. Starbucks developed its Pumpkin Spice Latte in 2003 while searching for a fall counterpart to its successful Peppermint Mocha. Pumpkin wasn’t an obvious choice at first; early customer research also pointed toward more familiar flavors like chocolate and caramel. But pumpkin stood out enough that the development team kept exploring the idea, at one point eating bites of pumpkin pie alongside shots of espresso to figure out which flavors worked together.13
The resulting drink debuted in about 100 stores in Washington, D.C., and Vancouver in 2003 before rolling out nationally the following year. Two decades later, pumpkin spice has escaped the coffee cup entirely, turning up in everything from cereal and cookies to candles and cosmetics.
So when does fall officially begin? The calendar says September. The leaves may say October. America’s coffee searches say August.
Here’s how all 50 states and Washington, D.C., rank for pumpkin spice latte search interest this season:
| Ranking | State | Relative Search Interest |
|---|---|---|
| 1 | Arizona | 100 |
| 2 | Colorado | 96 |
| 3 | Kentucky | 92 |
| 4 | California | 89 |
| 5 | Ohio | 87 |
| 6 | Virginia | 87 |
| 7 | Illinois | 87 |
| 8 | Indiana | 86 |
| 9 | Wisconsin | 86 |
| 10 | Missouri | 84 |
| 11 | South Carolina | 82 |
| 12 | Florida | 78 |
| 13 | Michigan | 78 |
| 14 | Tennessee | 78 |
| 15 | Pennsylvania | 77 |
| 16 | Texas | 71 |
| 17 | North Carolina | 70 |
| 18 | Kansas | 67 |
| 19 | Georgia | 63 |
| 20 | Washington | 63 |
| 21 | Nevada | 61 |
| 22 | West Virginia | 60 |
| 23 | New York | 59 |
| 24 | New Mexico | 57 |
| 25 | Massachusetts | 55 |
| 26 | Nebraska | 54 |
| 27 | North Dakota | 51 |
| 28 | Idaho | 47 |
| 29 | Connecticut | 45 |
| 30 | Wyoming | 44 |
| 31 | Iowa | 44 |
| 32 | Maryland | 44 |
| 33 | New Hampshire | 43 |
| 34 | Oregon | 42 |
| 35 | New Jersey | 42 |
| 36 | Utah | 40 |
| 37 | Minnesota | 40 |
| 38 | District of Columbia | 38 |
| 39 | Oklahoma | 38 |
| 40 | Arkansas | 34 |
| 41 | Delaware | 32 |
| 42 | South Dakota | 32 |
| 43 | Montana | 32 |
| 44 | Rhode Island | 32 |
| 45 | Hawaii | 31 |
| 46 | Maine | 31 |
| 47 | Alabama | 30 |
| 48 | Vermont | 29 |
| 49 | Louisiana | 27 |
| 50 | Alaska | 26 |
| 51 | Mississippi | 22 |
Methodology
To identify the most coffee-loving places in America, we analyzed Google Trends search data across all 50 states and Washington, D.C.
We began with a broad range of coffee-related searches covering how Americans buy, make, and drink coffee. These included topics such as coffee shops, major coffee chains, beans, brewing equipment, preparation methods, and popular drinks. Using the relative strength of these searches, we created a Search Interest Index to compare overall coffee interest across states and identify where coffee culture appears strongest.
To determine each state’s go-to coffee shop, we started with a broad list of major coffee chains before narrowing our analysis to 15 prominent brands. We then compared search interest related to each chain, including menus and nearby locations, to identify the brand that came out on top in each state.
Finally, we analyzed recent Google Trends data to see where interest in pumpkin spice lattes is strongest as the season gets underway. We also looked back at five years of search history to see when pumpkin spice latte interest typically peaks — and found a remarkably consistent pattern pointing to August.
Fair use statement
Innerbody Research is committed to providing objective, data-driven insights that help readers better understand health, lifestyle, and consumer trends. We created this report to explore America’s coffee habits and highlight the regional preferences and patterns shaping how people enjoy their daily cup.
You’re welcome to reference or share these findings for editorial, educational, or noncommercial purposes. We simply ask that you credit Innerbody.com and include a link back to this page.
Sources
Innerbody uses only high-quality sources, including peer-reviewed studies, to support the facts within our articles. Read our editorial process to learn more about how we fact-check and keep our content accurate, reliable, and trustworthy.
- Teixeira, M. (2026, April 14). Remote working, prices drive US home coffee consumption to highest in 14 years. Reuters.
- National Coffee Association. (2026, April 14). Coffee tops Americans’ beverage choices. National Coffee Association USA.
- UC Davis Library. (2024). The second wave of coffee. UC Davis Library Digital Exhibits: Brewed Awakening.
- Holden, B. (2023). Coffee in Seattle. HistoryLink.org.
- Pew Research Center. (2025). 2023–24 U.S. Religious Landscape Study interactive database. Pew Research Center.
- Fletcher, S. (2023, September 26). Why more and more young Latter-day Saints are drinking coffee. The Salt Lake Tribune.
- Mississippi Agricultural and Forestry Experiment Station. (2020). Tea time in Mississippi: MAFES researchers assist producers in niche crop. Mississippi State University.
- Tucker, K. L., Maras, J., Champagne, C., Connell, C., Goolsby, S., Weber, J., Zaghloul, S., Carithers, T., & Bogle, M. L. (2005). A regional food-frequency questionnaire for the US Mississippi Delta. Public Health Nutrition, 8(1), 87–96.
- USA Symbol. (2026). Dunkin’ Donuts locations by state. USA Symbol.
- 7 Brew. (2026). About 7 Brew. 7 Brew Coffee.
- National Weather Service. (2020). Climatological report: Phoenix, AZ. National Weather Service Weather Forecast Office Phoenix, AZ.
- Eschner, K. (2017). Even colonial Americans liked pumpkin spice. Smithsonian Magazine.
- Chasan, A. (2024). Pumpkin spice season kicks off earlier each year. Here's a look at the history of America's enduring love for the pie-inspired flavor. CBS News.

Copyright © Innerbody Research 1997 - 2025. All Rights Reserved.