Healthcare Disparities in the U.S.
In this study, we explore factors leading to healthcare disparities in BIPOC communities and examine states with the lowest insured BIPOC populations.

Healthcare access, quality of care, and social factors (e.g., income, housing, and food insecurity) all affect the health outcomes of a country’s residents, and growing evidence points to wellness gaps and disparities across racial and ethnic groups in the United States.1 To understand the distribution of these impacts, we examined several health disparity measures: insurance status, healthcare quality, and life expectancy by race.
Jump to:
Key takeaways
- Based on 2024 numbers, the uninsured rate among all Americans stands at 8.2%, a statistically significant increase from the previous year.
- Texas has the highest percentage of uninsured residents (16.7%), while Massachusetts has the lowest percentage (2.8%).
- Asian people have the lowest uninsured rate in the United States, per the U.S. Census Bureau.
- American Indian and Alaska Native populations contend with the highest rates of uninsured people. In Tennessee, nearly half of the American Indian population is uninsured.
- Republican states typically have more uninsured residents than their Democratic counterparts.
- American Indian and Alaska Natives (70.1 years) and the Black population (74 years) have the lowest life expectancy among the U.S. population.
- Among all racial groups, American Indian/Alaska Native and Black children have the lowest vaccination rates.
Overview
We took the most recent published data from the U.S. Census American Community Survey, National Healthcare Quality and Disparities Report, and the Centers for Disease Control and Prevention (CDC) to identify numerous factors that could be impacted by systemic and institutional racism in the U.S. healthcare system.

Healthcare coverage in the U.S.
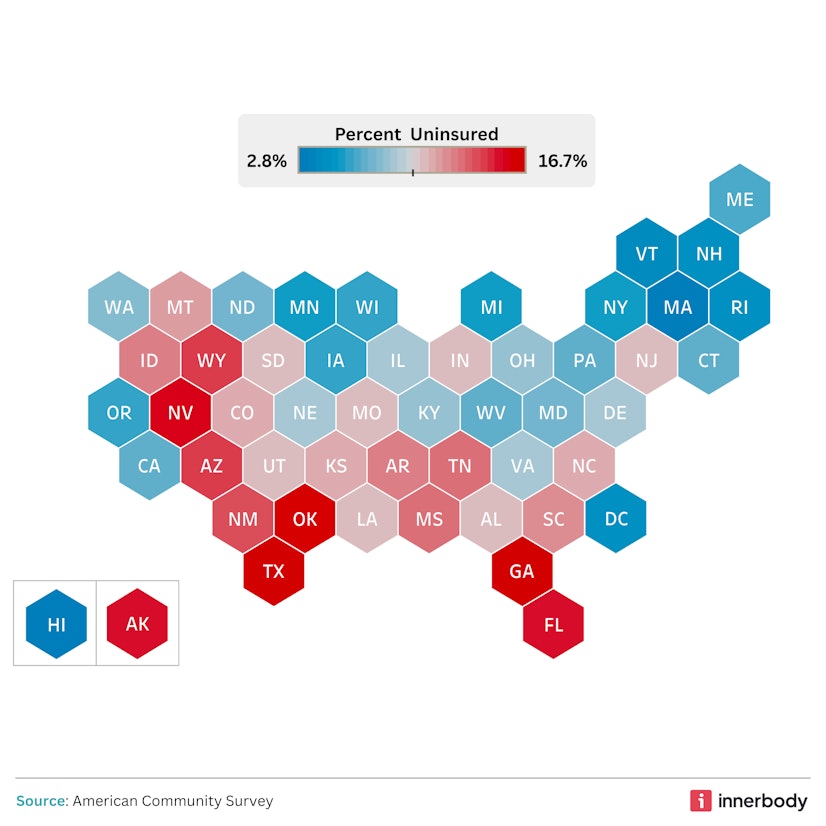
image by Innerbody Research
The U.S. Census Bureau reports that toward the end of 2024, to which the most recent survey data pertains, the uninsured rate among all U.S. residents was 8.2%, a statistically significant increase from the previous year’s rate of 7.9%.2 Texas continued to have the highest percentage of uninsured residents (16.7% of its population), while Massachusetts again had the lowest (2.8%).
In terms of specific racial classifications, the Census Bureau reports that Asians are the population with the lowest rate of uninsured (5.2%), followed closely by the White population (5.7%). On the other hand, American Indians and Alaska Natives have the highest uninsured rate (18.9%).3
On a regional level, there’s a trend as to where we find the highest rates of uninsured among each racial/ethnic population:15
- American Indian and Alaska Native: Tennessee (48.5% uninsured)
- Asian: Wyoming (15.3% uninsured)
- Black: North Dakota (26.7%)
- Native Hawaiian/Pacific Islander: Arkansas (52.8% uninsured)
- Hispanic or Latino: Tennessee (32.2% uninsured)
- White: Texas (11.7% uninsured)
This data lends itself to a strong connection between more traditionally Republican states having a larger percentage of uninsured residents than their Democratic neighbors. Several factors are at play here, such as:
Opposition to the Affordable Care Act (ACA)
The ACA helps expand access to insurance coverage, contributing to lower uninsured rates generally.12 Indeed, per the Office of Health Policy, enhanced ACA subsidies may have been largely responsible for the record-low 7.7% rate in early 2023.13 But Republican leaders and advocacy groups have historically opposed the ACA, potentially shaping negative opinions of it among their constituents, according to research.4
Lack of trust in the government
Research also shows that Republicans are less likely to trust the federal government and its role in healthcare.4 They are therefore more suspicious of government-subsidized systems that would increase health insurance enrollment, such as the ACA.
Geographic variation
In some areas, there’s a correlation between low insurance enrollment and large rural populations.14 Residents of such areas often have limited access to healthcare, which may be a disincentive to purchasing health insurance.
Regardless of political affiliation, income inequality can play a role in the rate of uninsured Americans throughout the country. Not everyone has access to healthcare through their job, and even when it is available, premiums are often still too expensive for families to afford.
Healthcare quality by race

image by Innerbody Research
The National Health Quality and Disparities Report (NHQDR) provides data identifying healthcare gaps across geographic regions of our country. The benchmarks examined in the report give a closer look at health disparities among vulnerable populations.
Appendix C of the most recently published report (2024) lays out the disparities most directly. Using the White population as the reference point, it shows that non-White racial and ethnic groups in the United States experienced worse access to care across 25-79% of specific measures, and better access to care across only 7-31% of measures. As to quality of care, it was felt to be worse across 27-41% of measures, and better across 10-23% of measures.
Elsewhere in the report you’ll find further disparities concerning other areas of healthcare.
Regarding person-centered care, White adults (85.3%) were the most likely to feel that their provider “always explained things in a way that was easy to understand,” compared to 75.3% of Asian adults. In addition, 86.1% of White adults and 85.8% of Black adults reported that home healthcare providers “always listened carefully to them” in the previous two months of their care, while just 77.8% of Asian residents reported the same experience.
Data on standard effectiveness-of-care and healthy-living benchmarks also give insight into potential racial disparities. Interestingly, Asian, Black, and Native Hawaiian/Pacific Islander populations have undergone more frequent blood cholesterol measurements within the past five years than any other racial group. However, less than 10% of Black and American Indian/Alaska Native patients who were treated for chronic kidney failure received a kidney transplant within three years of renal failure, standing in considerable contrast to 17.3% of White patients.
Further contrasts are seen with regard to women and AFAB individuals getting regular mammograms, which is essential for breast cancer prevention and early detection. While a large percentage of Black (81.7%) and White (75.7%) women aged 50-74 reported receiving a mammogram in the previous two years, the numbers drop to 59% for American Indian/Alaska Native women and around 66% for Asian and Native Hawaiian/Pacific Islander women.
Of final note here, the NHQDR revealed that American Indian/Alaska Native and Black children have the lowest vaccination rates among all racial groups. This issue is multifaceted, stemming from not only a potential lack of healthcare access but also a trend of vaccine hesitancy among Black American and Native American mothers, which itself may be informed by historically negative healthcare interactions related to structural gendered racism.5 16 This structural issue persists today, particularly in the case of Black patients, who are the least likely to get the help or advice they need on the same day they contact their home health provider.
American life expectancy by race and ethnicity
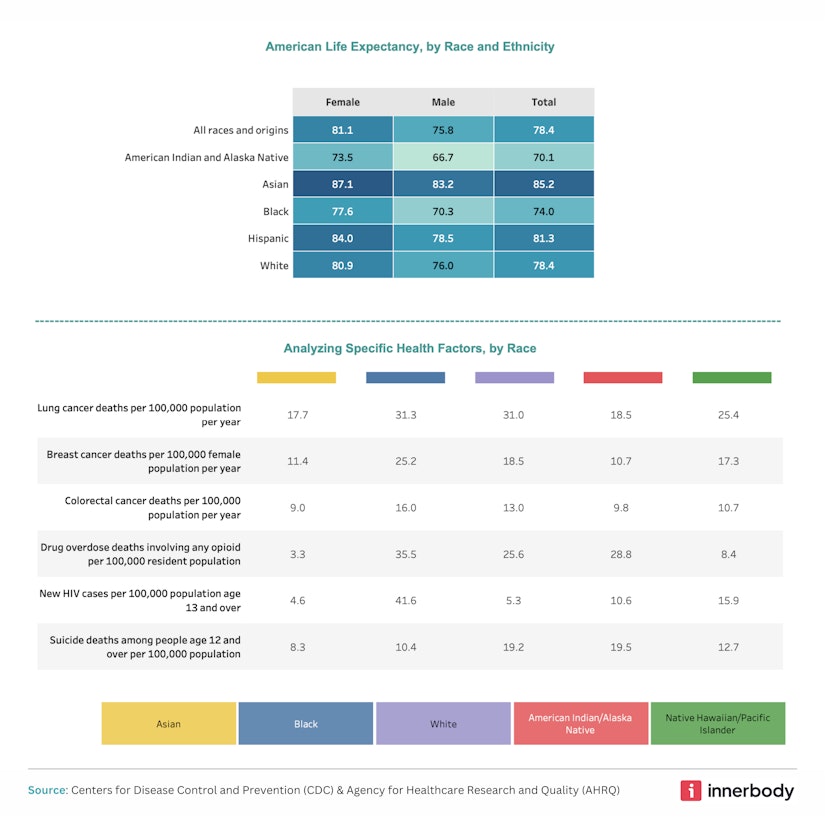
image by Innerbody Research
While advancements in public health have led to a continually increasing lifespan for Americans overall, significant differences in life expectancy remain between racial groups in the United States.6 Asian men and women tend to live significantly longer compared to other populations, with an average life expectancy of 85.2 years. Conversely, American Indians/Alaska Natives and Black Americans have life expectancies of 70.1 years and 74 years, respectively.
Women have historically lived longer than men across all races and continue to do so.6 So, why is that? It could be due to several reasons:
- Healthcare utilization: Women tend to seek healthcare services more often than men, leading to earlier detection and treatment.7
- Lifestyle choices: Men are more prone to risky behaviors like smoking and excessive alcohol consumption.8
- Occupational hazards: Men are overrepresented in hazardous occupations like firefighting and military service.9
- Health risks: While heart disease affects all sexes, men are typically affected at an earlier age.10
Health risks are worth examining more broadly, as specific health conditions are also associated with racial disparities in the United States. For example, Black Americans aged 13 and above are disproportionately affected by HIV, with a rate of 41.6 new cases per 100,000 people. Sadly, this rate of infection is around 3-9 times higher than that of any other racial group.
Black Americans also experience the highest rates of drug overdose from opioids, death by colorectal cancer, and hospital admissions for heart failure compared to other racial groups. The most alarming of these measures is the last one — hospital admissions for heart failure — with an estimated rate of 866.4 out of every 100,000. This is in stark contrast to just 320.8 admissions per 100,000 White people and 196.4 per 100,000 Asians/Pacific Islanders.
The reasons for disparities such as these run deep. In addition to the usual heart disease risk factors, like obesity and diabetes, researchers have noted that racial discrimination, food insecurity, and struggles with income feed the stress that can significantly contribute to the risk of hypertension and heart disease in Black Americans.11
Methodology
We performed a comprehensive data analysis examining healthcare disparities, including life expectancy, insurance rates, and quality of care, in order to identify the states and racial groups facing the most significant healthcare challenges. Our investigation drew upon the most recent publicly available surveys, reports, and other data from the Centers for Disease Control and Prevention (CDC), the U.S. Census Bureau, and the Agency for Healthcare Research and Quality. We restricted our supplemental sources to reputable scientific journals and health research organizations.
Fair use statement
Innerbody Research is committed to providing objective, science-based suggestions and research to help our readers make more informed decisions regarding health and wellness. We dedicated our resources to crafting this brief on the prevailing social injustices within the U.S. healthcare system and igniting discussions on avenues for improvement based on our findings. Because we aim to reach as many people as possible by making this information widely available, please feel free to share our content for educational, editorial, or discussion purposes. We ask only that you link back to this page and credit the author as Innerbody.com.
Sources
Innerbody uses only high-quality sources, including peer-reviewed studies, to support the facts within our articles. Read our editorial process to learn more about how we fact-check and keep our content accurate, reliable, and trustworthy.
Paradies, Y., et al. (2015). Racism as a determinant of health: A systematic review and meta-analysis. PLoS ONE, 10(9), e0138511.
Carter, C. (2025). Health insurance coverage by state: 2023 and 2024. U.S. Census Bureau.
U.S. Census Bureau. (2024). Selected characteristics of health insurance coverage in the United States. U.S. Census Bureau.
Dalen, J. E., Waterbrook, K., & Alpert, J. S. (2015). Why do so many Americans oppose the Affordable Care Act? The American Journal of Medicine, 128(8), 807-810.
Thornton, C., & Reich, J. A. (2022). Black mothers and vaccine refusal: Gendered racism, healthcare, and the state. Gender & Society, 36(4), 525-551.
Medina, L.D., Sabo, S., & Vespa, J. (2020). Living longer: Historical and projected life expectancy in the United States, 1960 to 2060. U.S. Census Bureau.
Ashman, J.J., Santo, L., & Okeyode, T. (2021). Characteristics of office-based physician visits by age, 2019. U.S. Centers for Disease Control and Prevention.
Shmerling, R.H. (2020). Why men often die earlier than women. Harvard Health Publishing, Harvard Medical School.
Stergiou-Kita, M., et al. (2015). Danger zone: Men, masculinity and occupational health and safety in high risk occupations. Safety Science, 80, 213-220.
Harvard Health Blog. (2016). Understanding the heart attack gender gap. Harvard Medical School.
Williamson, L. (2021). The link between structural racism, high blood pressure, and Black people’s health. American Heart Association.
Kominski, G. F., Nonzee, N. J., & Sorensen, A. (2016). The Affordable Care Act’s impacts on access to insurance and health care for low-income populations. Annual Review of Public Health, 38, 489-505.
Office of the Assistant Secretary for Planning and Evaluation. (2023). National uninsured rate reaches an all-time low in early 2023 after close of ACA Open Enrollment period. U.S. Department of Health and Human Services.
Federal Housing Finance Agency. (2024). Who lives in rural America? FHFA.
U.S. Census Bureau. (2024). Selected characteristics of health insurance coverage in the United States: Uninsured by state. U.S. Census Bureau.
Zhao, J., et al. (2025). Multi-level determinants of vaccination of the American Indian and Alaska Native population: A comprehensive overview. Frontiers in Public Health, 13, 1490286.

Copyright © Innerbody Research 1997 - 2025. All Rights Reserved.
