Which States Love Ice Cream the Most, and Who's Eating What Flavors?
Some states stick with the classics. Others do their own thing. Search data shows what Americans actually want in a scoop.

Ice cream doesn’t really have an “offseason.” It shows up at birthday parties, after long summer days, and sometimes straight from the freezer with a spoon and no real plan. For something so simple, it’s one of the few foods that works just as well for a celebration as it does on a quiet Tuesday night.
The average American eats around 4 gallons of ice cream each year, making it one of the country’s most enduring dessert habits — and supporting an industry worth roughly $11.6 billion.1
Even though we eat a lot of it year-round, summertime is when Americans crave ice cream even more. But does everyone reach for the same scoop? Or does where you live quietly shape whether you choose strawberry, cookie dough, or something a little less expected? And “we all scream for ice cream,” as they say, but do some states scream louder than others?
To find out, we analyzed search data trends across all 50 states (and D.C.), looking at regional preferences, brand loyalty, and how flavor choices vary across the country.
Here’s where Americans are most obsessed with ice cream — and what they’re actually eating.
Jump to:
Key takeaways
- New Jersey is America’s most ice-cream-obsessed state, and its neighbors aren’t far off.
- The Northeast sweeps the top five for ice cream search interest — with Delaware, Massachusetts, Connecticut, and New York all near the top — and contributes seven of the ten most ice-cream-loving states overall. Cold weather, it turns out, isn’t much of a deterrent.
- At the other end of the list, Arkansas ranks as the state least interested in ice cream in our study, followed by North Dakota and Oklahoma.
- The “Dairy Belt” also stands out for an unexpected reason. Despite their reputation for dairy production, states like Minnesota (48th) and Wisconsin (47th) land near the bottom. Maybe ice cream finds them, not the other way around.
- Strawberry is the undisputed national champion. Moving past the classic vanilla versus chocolate debate, it’s the most-searched flavor nationwide — and the top pick in states like California, Texas, and Michigan.
- Halo Top, known for its lower-calorie “light” ice cream, is the most-searched brand nationwide — which suggests we want dessert, but also want to feel like we made a responsible decision.
- Chocolate chip (#2) and cookie dough (#3) both outrank plain chocolate (#4) and vanilla (#5) nationwide — a sign that upgraded classics are now the default. That trend shows up at the state level, too: cookie dough ranks as the top flavor in Massachusetts, while chocolate chip leads in Pennsylvania.
- Talenti ranks as the No. 4 “ice cream” brand — and even takes the top spot in New Jersey — despite technically being gelato. We’re not here to correct anyone, but the lines are clearly blurred.
- Some states don’t overthink it — they go with the hometown favorite: Texas with Blue Bell, Vermont with Ben & Jerry’s, Oregon with Tillamook, Pennsylvania with Turkey Hill, and Arkansas with Walmart’s Great Value. Local loyalty still goes a long way.
- Cold Stone Creamery ranks as the second-most-searched brand nationwide and leads in 13 states, including Arizona, California, Colorado, Idaho, and Utah — which is a lot of people willingly saying yes to whatever happens on that cold slab.
- As with brands, some regional flavor trends make lots of sense — blueberry in Maine, coconut in Hawaii, and peach in South Carolina, to name a few.
- In some states, the top search looks a little different — Florida with boba ice cream, Oregon with lavender, and Kansas with matcha. Not everyone showed up to the same dessert meeting, or even the same menu.
States that love ice cream the most (and least)
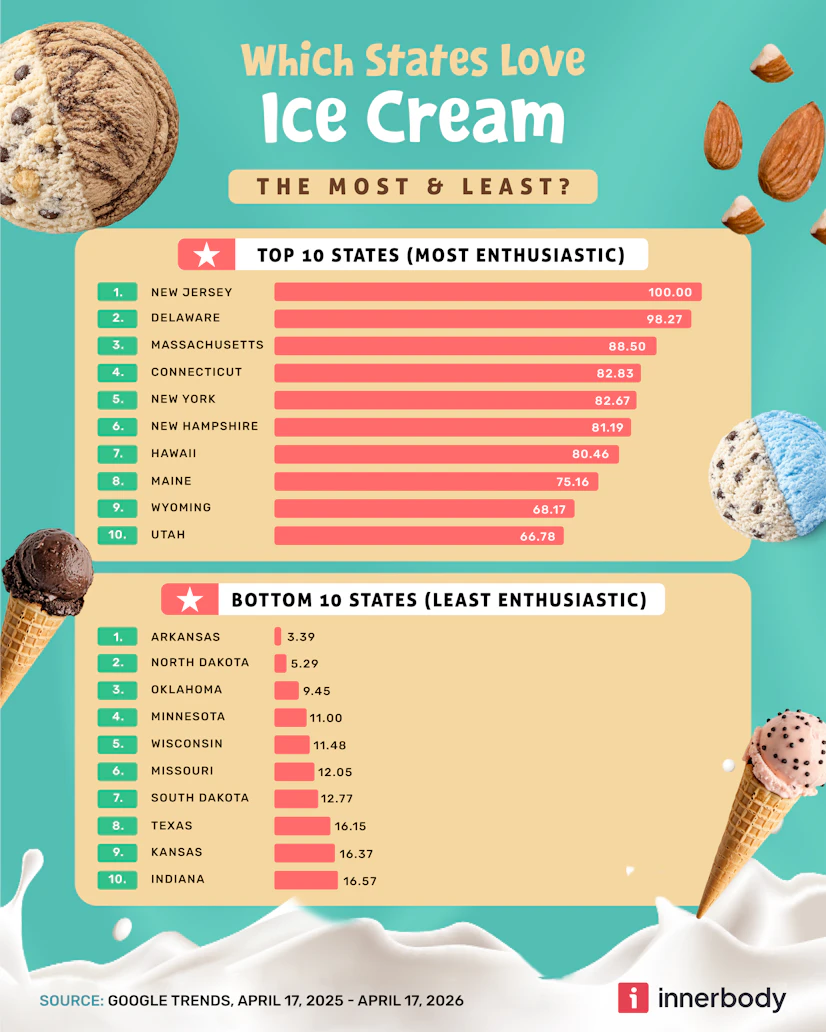
Image by Innerbody Research
New Jersey takes the top spot in our rankings, with Delaware, Massachusetts, and Connecticut close behind. Zoom out, and the pattern is hard to miss: the Northeast dominates the top of the list.
Here are the ten states with the highest overall ice cream search interest:
- New Jersey
- Delaware
- Massachusetts
- Connecticut
- New York
- New Hampshire
- Hawaii
- Maine
- Wyoming
- Utah
At first glance, that’s a little backward. Ice cream is supposed to be a hot-weather food — so why are colder states leading in search interest?
Part of the answer may be that in the Northeast, ice cream isn’t just seasonal. It’s historical.
Long before refrigeration, New England had a built-in advantage: access to both dairy and stored ice. Winters made it possible to harvest and preserve ice, while local farms supplied the cream — helping to turn ice cream from a novelty into something routine. Early soda fountains along the East Coast brought it into everyday life, and the habit stuck.2 3 Today, the region still reflects that legacy, with some of the highest concentrations of ice cream shops per capita.4
This isn’t a recent pattern, either. In 1987, New Englanders consumed about 51% more ice cream per person than the national average — an early sign of just how embedded it had become.5
That history may also help explain why brands like Howard Johnson’s, Carvel, Friendly’s, and Ben & Jerry’s are all rooted in the region.2
What about outside the Northeast?
Utah tells a different story. A large portion of the population follows religious guidelines that discourage alcohol, tobacco, and caffeine — so sweets, including ice cream, often step in as the social fallback. In other words, fewer bars, more dessert menus.6
Hawaii follows a different pattern entirely. With the state’s year-round warm climate, ice cream isn’t seasonal — it’s always in play. It’s also woven into the local dessert scene, often served alongside favorites such as shaved ice. Some analyses even rank Hawaii among the states with the highest number of ice cream shops per capita.12
Tourism adds another layer. Hawaii draws millions of visitors every year, bringing a steady stream of demand on top of its resident base.
Not every state follows that pattern, though, and the bottom of the list looks very different.
Here are the ten states with the lowest overall ice cream search interest:
- Arkansas
- North Dakota
- Oklahoma
- Minnesota
- Wisconsin
- Missouri
- South Dakota
- Texas
- Kansas
- Indiana
Unlike the Northeast cluster at the top, the lowest-ranking states lean heavily toward the Midwest and Plains. From the Dakotas to Kansas and Indiana, much of the list falls within a relatively tight geographic band.
The gap is also hard to ignore. Relative to New Jersey’s top search interest score of 100, several of the lowest-ranking states fall into the low teens or even single digits. Arkansas, for example, comes in at just 3.39.
It also makes some of the results especially surprising. States like Wisconsin and Minnesota — long associated with dairy production — rank near the bottom. Wisconsin alone produces more than 30 billion pounds of milk annually, yet that proximity doesn’t translate into higher search interest.7 Apparently, being surrounded by cows doesn’t mean you feel like ice cream.
Some warmer states stand out, too. Texas lands near the bottom ten despite a climate where you might expect ice cream to thrive. Maybe Texans are more into popsicles and shaved ice?
Here’s the full ranking, including each state’s relative search interest score:
| Ranking | State | Search Interest Index |
|---|---|---|
| 1 | New Jersey | 100.00 |
| 2 | Delaware | 98.27 |
| 3 | Massachusetts | 88.50 |
| 4 | Connecticut | 82.83 |
| 5 | New York | 82.67 |
| 6 | New Hampshire | 81.19 |
| 7 | Hawaii | 80.46 |
| 8 | Maine | 75.16 |
| 9 | Wyoming | 68.17 |
| 10 | Utah | 66.78 |
| 11 | California | 65.57 |
| 12 | Vermont | 57.53 |
| 13 | Nevada | 55.57 |
| 14 | Rhode Island | 55.26 |
| 15 | Mississippi | 51.83 |
| 16 | Maryland | 51.56 |
| 17 | Pennsylvania | 51.30 |
| 18 | Colorado | 49.87 |
| 19 | Alaska | 48.21 |
| 20 | Virginia | 45.51 |
| 21 | South Carolina | 45.16 |
| 22 | Washington | 44.40 |
| 23 | Alabama | 43.69 |
| 24 | Louisiana | 43.09 |
| 25 | West Virginia | 41.70 |
| 26 | Michigan | 39.70 |
| 27 | Arizona | 34.75 |
| 28 | Tennessee | 34.45 |
| 29 | Ohio | 34.33 |
| 30 | Georgia | 33.74 |
| 31 | Kentucky | 32.50 |
| 32 | New Mexico | 31.00 |
| 33 | District of Columbia | 30.58 |
| 34 | Illinois | 29.39 |
| 35 | Florida | 29.08 |
| 36 | Montana | 28.78 |
| 37 | Oregon | 27.52 |
| 38 | North Carolina | 24.70 |
| 39 | Nebraska | 20.44 |
| 40 | Iowa | 20.35 |
| 41 | Idaho | 20.02 |
| 42 | Indiana | 16.57 |
| 43 | Kansas | 16.37 |
| 44 | Texas | 16.15 |
| 45 | South Dakota | 12.77 |
| 46 | Missouri | 12.05 |
| 47 | Wisconsin | 11.48 |
| 48 | Minnesota | 11.00 |
| 49 | Oklahoma | 9.45 |
| 50 | North Dakota | 5.29 |
| 51 | Arkansas | 3.39 |
Favorite ice cream brands by state and nationwide

Image by Innerbody Research
The brand map tells an interesting story about America and ice cream. National names like Halo Top and Cold Stone Creamery show up across wide swaths of the country, but many states still lean toward brands with regional roots.
Cold Stone Creamery has the strongest state-by-state footprint, leading in 13 states, especially across the West and Mountain West. Since it was founded in Arizona, perhaps it’s not surprising to see it lead there. Halo Top, meanwhile, ranks as the most-searched brand nationwide and appears across several regions, including the Midwest in states like Michigan and Illinois — a sign that lower-calorie “light” ice cream has gone fully mainstream.
But the most interesting results may be the local holdouts:
- Texas sticks with Blue Bell, founded in Brenham in 1907.
- Vermont backs Ben & Jerry’s, born in Burlington in 1978.
- Oregon leans toward Tillamook, which began making ice cream there in 1947.
- Pennsylvania favors Turkey Hill, a Lancaster County staple since 1931.
- Ohio sticks with Graeter’s, a Cincinnati original dating back to 1870.
- Iowa turns to Blue Bunny, founded in Le Mars in 1913.
- Massachusetts opts for Friendly’s, a Springfield-born chain serving ice cream since 1935.
Even Arkansas follows the hometown pattern, with Walmart’s Great Value brand coming out on top.
Some of this may also come down to logistics. Ice cream requires strict temperature control, and according to industry research, the majority of ice cream sold in the U.S. is produced and marketed regionally to help maintain product quality throughout distribution.1 8 Changes in elevation and pressure during transport can also affect texture and stability, reinforcing the advantage of staying closer to home.13 Over time, that kind of regional footprint can help local brands build strong followings in their own markets.
But when you zoom out beyond regional strongholds, a different pattern emerges. After identifying the most prominent brands in the country and then assessing the relative search interest in them to rank these top brands by popularity, a handful of brands rose to the top nationwide.

Image by Innerbody Research
At the top is Halo Top — which, as we’ve mentioned, is a company that built its entire identity around being the lighter, lower-calorie option in a category not exactly known for restraint. It’s a relatively new player, but its top placement proves “better-for-you” ice cream isn’t a niche anymore.
Right behind it is Cold Stone Creamery, which turned ice cream into an event. For the uninitiated, it’s less a shop and more a manual labor demonstration. You watch a person take a scoop of ice cream and essentially street-fight it on a frozen granite slab, folding in toppings with an intensity usually reserved for kneading sourdough. And of course, Cold Stone Creamery can also be found in grocery aisles across the country.
Then there’s Breyers, which has been around since the 1800s and still shows up near the top. In a category that cycles through trends, that kind of staying power says something about how much people still rely on the familiar.
Talenti lands at No. 4 — despite being gelato. Yes, some education is in order. Gelato differs from traditional ice cream in a few key ways: it’s churned more slowly, which means less air, and it typically contains less fat. The result is a denser, smoother texture with more intense flavor. So when people search this much for “Talenti ice cream,” they’re clearly not splitting hairs over definitions.
And then there’s Häagen-Dazs, a brand that sounds European, was founded in New York, and helped define what “premium” ice cream looks like in the U.S. It’s been doing the same thing for decades — and apparently, that still works.
At the other end of the rankings, the bottom five of these top brands may reflect something less about taste and more about reach. Graeter’s, Friendly’s, Van Leeuwen, and Hood all have more limited or regional footprints — and when a brand isn’t in every freezer aisle, it tends to show up less in nationwide search data.
Here’s the full list of rankings for ice cream brands with the highest search interest:
| Ranking | Brand | Search Interest Index |
|---|---|---|
| 1 | Halo Top | 59.53 |
| 2 | Cold Stone Creamery | 53.08 |
| 3 | Breyers | 49.87 |
| 4 | Talenti | 37.49 |
| 5 | Häagen Dazs | 33.94 |
| 6 | Tillamook | 25.84 |
| 7 | Baskin-Robbins | 25.25 |
| 8 | Blue Bell | 19.99 |
| 9 | Walmart Great Value | 19.70 |
| 10 | Jeni's Splendid Ice Creams | 19.43 |
| 11 | Blue Bunny | 17.38 |
| 12 | Whole Foods 365 | 16.70 |
| 13 | Kroger Private Selection | 12.85 |
| 14 | Turkey Hill | 10.62 |
| 15 | Hood Ice Cream | 10.53 |
| 16 | Van Leeuwen | 10.52 |
| 17 | Friendly's | 10.40 |
| 18 | Ben & Jerry's | 10.25 |
| 19 | Graeter's | 4.24 |
What’s each state’s favorite ice cream flavor?
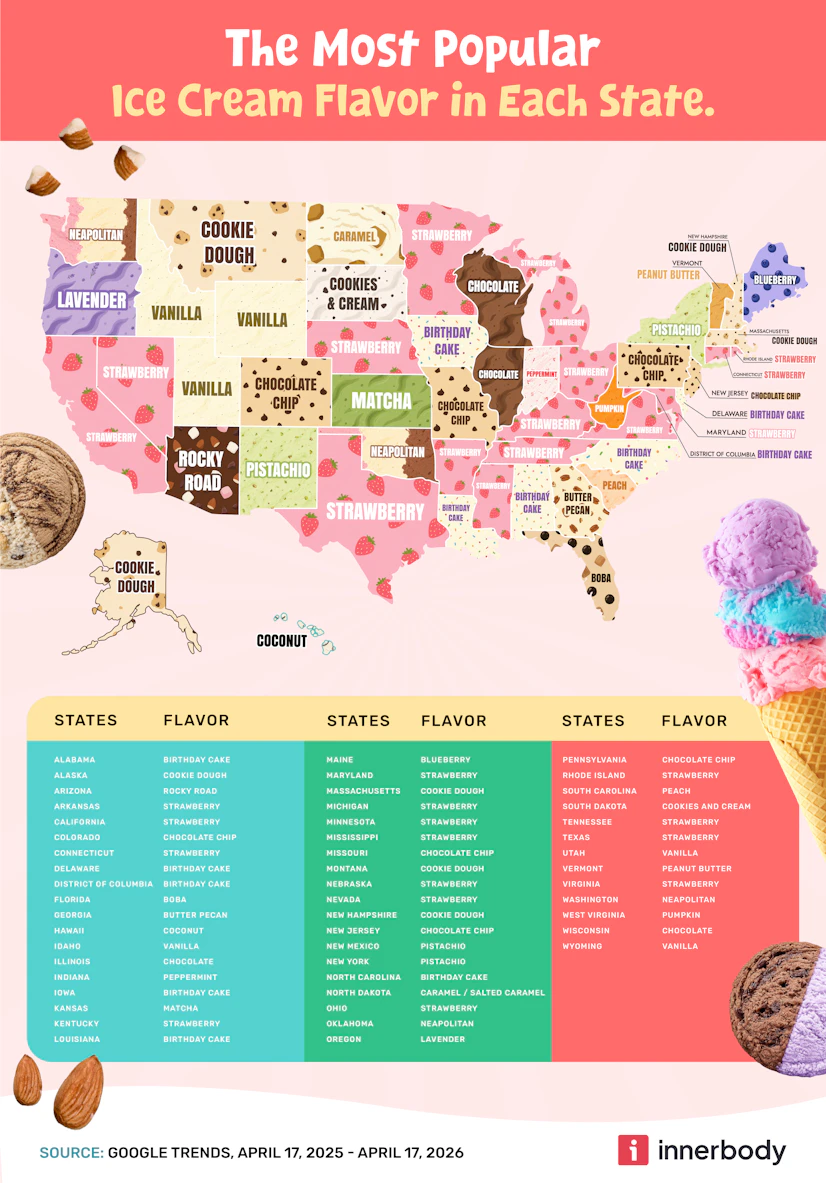
Image by Innerbody Research
The flavor map is where things start to get even more interesting. While brand preferences split across regions, flavor choices reveal a mix of tradition, geography, and the occasional curveball.
We used search data to determine the most popular flavors and then assessed the relative interest in these top flavors to determine overall popularity and regional preferences. One pattern stands out immediately: strawberry is everywhere. It shows up across a wide range of states — from California and Texas to Michigan and Virginia — making it the most geographically consistent flavor in the dataset. That staying power isn’t new. Strawberry has been part of American ice cream culture for generations, with fruit-based flavors among the earliest varieties popularized in the U.S.9
But not every state sticks with the classics. Birthday cake shows up across multiple regions, from Alabama to North Carolina — a flavor that only really took off in the late 1980s, when chains like Cold Stone Creamery began popularizing cake batter ice cream.
In a few places, the map still reflects what’s grown locally. Maine leans blueberry, South Carolina goes with peach, and Hawaii lands on coconut — small reminders that ice cream flavors often trace back to regional ingredients and agricultural identity.10 11
And then there are the outliers. Florida shows a preference for “boba” ice cream, Oregon goes with lavender, and Kansas opts for matcha — flavors you don’t usually run into unless you go looking for them.
Taken together, the map suggests that while Americans may agree on one thing — more ice cream, please — flavor is where individual states start to do their own thing.
That’s how it looks by state. Zoom out, and a clear set of favorites — and a few surprises — start to emerge nationwide. Among the top flavors in the country, here are the 5 most and least popular.

Image by Innerbody Research
At the top of the list, there’s a small but telling shift. Chocolate chip and cookie dough both rank ahead of plain chocolate and vanilla, even though they’re essentially just upgraded versions of those originals.
Both flavors are relatively modern additions. Chocolate chip ice cream didn’t take off until the mid-20th century, and cookie dough wasn’t popularized until the 1980s by Ben & Jerry’s. Decades later, they’ve gone from novelty to default.
At the other end of the list, the pattern flips. These aren’t classic flavors so much as specific ones, often tied to regions, trends, or particular food cultures.
- Ube: A purple yam commonly used in Filipino desserts, known for its vibrant color and subtly sweet, nutty flavor. It’s grown in popularity in the U.S. in recent years, but still tends to show up more in specialty shops than as a standard ice cream option.
- Blue Moon: A Midwest specialty with a hard-to-pin-down flavor — often described as a mix of citrus, vanilla, and almond. It’s a regional classic in states like Wisconsin and Michigan, but remains largely unknown outside that part of the country.
- Mocha: Coffee-based desserts have been popular for decades, but they’ve always lived more comfortably in cafés than in freezer aisles — which may explain why mocha shows up less often as a default ice cream pick.
- Lavender: Floral flavors have long been associated with European-style desserts and small-batch creameries, but they’ve never quite broken into the U.S. mainstream, where sweeter, more familiar profiles tend to win out. Lavender is popular in pockets like the Pacific Northwest, but rare elsewhere.
- Mango: While mango is one of the most widely consumed fruits in the world, its presence in American ice cream has been more limited, often showing up in international or specialty brands rather than as a standard option.
These picks aren’t necessarily less appealing, just less universal. Americans may try new flavors, but the classics still come first.
If your favorite flavor wasn’t in the top or bottom 5, you might find it elsewhere in the full rankings:
| Ranking | Flavor | Search Interest Index |
|---|---|---|
| 1 | Strawberry | 82.24 |
| 2 | Chocolate Chip | 74.45 |
| 3 | Cookie Dough | 73.90 |
| 4 | Chocolate | 73.82 |
| 5 | Vanilla | 70.71 |
| 6 | Neapolitan | 64.39 |
| 7 | Birthday Cake | 60.59 |
| 8 | Cookies and Cream | 56.59 |
| 9 | Coffee | 54.18 |
| 10 | Rocky Road | 54.14 |
| 11 | Pistachio | 52.11 |
| 12 | Mint Chocolate Chip | 52.00 |
| 13 | Peach | 51.86 |
| 14 | Lemon | 50.08 |
| 15 | Peanut Butter | 49.98 |
| 16 | Caramel / Salted Caramel | 48.24 |
| 17 | Cherry | 44.53 |
| 18 | Pumpkin | 43.87 |
| 19 | Peppermint | 41.61 |
| 20 | Butter Pecan | 38.09 |
| 21 | Creamsicle | 36.10 |
| 22 | Coconut | 35.69 |
| 23 | Matcha | 31.10 |
| 24 | Boba | 24.47 |
| 25 | Blueberry | 23.71 |
| 26 | Moose Tracks | 23.34 |
| 27 | Mango | 21.82 |
| 28 | Lavender | 21.59 |
| 29 | Mocha | 16.13 |
| 30 | Blue Moon | 11.18 |
| 31 | Ube | 8.92 |
Methodology
To identify the most popular ice cream brands and flavors across all 50 states and the District of Columbia, we analyzed Google Trends search data over a 12-month period.
We cast a deliberately wide net, examining search trends for close to 30 major brands and 50 flavors and 30 major brands before identifying the top 19 brands and top 31 flavors (and no, that's not a nod to Baskin-Robbins). Brand and flavor analyses were kept strictly to those terms in association with ice cream (e.g., “Talenti ice cream”). In our analysis, we considered the strength and breadth of national and regional interest in specific flavors and brands, as well as the stability of ice cream interest within each state according to Google Trends data.
By combining data about flavors and brands while normalizing metrics to a common scale, we arrived at a search interest index score for each state. We also found out which flavors and brands were of most and least interest both locally and nationally.
Fair use statement
Innerbody Research is committed to providing objective, research-based insights to help readers make more informed decisions. We created this report to spark conversation around regional trends and preferences, and we encourage others to share these findings for educational, editorial, or discussion purposes.
If you reference this content, please include a link back to this page and credit Innerbody.com.
Sources
Innerbody uses only high-quality sources, including peer-reviewed studies, to support the facts within our articles. Read our editorial process to learn more about how we fact-check and keep our content accurate, reliable, and trustworthy.
International Dairy Foods Association. (2024). Ice cream sales & trends. IDFA.
New England Historical Society. (2024). New England has an ice cream love affair. NEHS.
Traverso, A. (2022). The best ice cream in every New England state. NewEngland.com.
Leach, T. (2025). The sweetest states: Where America loves ice cream most. Dairy Herd Management.
Franckling, K. (1987). Even in winter, New Englanders take ice cream seriously. UPI Archives.
Peterson, K. (2024). Utahns love sugar, the perception goes. But when it comes to ice cream, the data shows otherwise. The Salt Lake Tribune.
Wisconsin Department of Agriculture, Trade and Consumer Protection (DATCP). (2024). Wisconsin Milk Marketing Board (d/b/a Dairy Farmers of Wisconsin). DATCP.
Hillphoenix Learning Center. (2015). Ice cream product integrity and the importance of the cold chain. Hillphoenix.
Small, S., & Kiedrowski, I. (2025). A brief history of ice cream. Dumbarton House.
Calderwood, L., Yarborough, D. E., & Tooley, B. (2025). About the Maine wild blueberry. University of Maine Cooperative Extension.
South Carolina Department of Agriculture. (2024). Peaches. South Carolina Department of Agriculture.
Tepper Paley, R. (2015). This state is more obsessed with ice cream than all the rest. Yahoo Food.
Dubey, U. K., & White, C. H. (1997). Ice cream shrinkage: A problem for the ice cream industry. Journal of Dairy Science, 80(12), 3441-3444.

Copyright © Innerbody Research 1997 - 2025. All Rights Reserved.
