Have Our Perceptions of the Flu Changed Due to COVID-19?
We surveyed 970 people to find out how concerned Americans are about catching this year’s seasonal flu versus catching COVID-19.

As respiratory syncytial virus (RSV) cases have risen and COVID-19 remains a lingering concern across much of the globe, the sudden jumpstart of the 2022-2023 flu season is expected to put a strain on vulnerable populations and health services providers this winter.
According to the World Health Organization (WHO), influenza viruses A and B have already begun circulating among all age groups, especially school-age children. The more worrisome of the two, influenza A, can cause severe problems for older individuals and those with chronic conditions; those 55 years or older account for almost half of hospital admissions due to influenza.
The WHO strongly recommends those who can get vaccinated for this year’s seasonal flu should do so. Not only does it decrease one’s chance of being infected with influenza, but it also reduces the risk of a subsequent severe illness after catching COVID-19 or the flu. But how likely are Americans to take this advice? We surveyed 970 people to find out.
Jump to:
Key takeaways
- The youngest among us — those 6 months to 12 years old — are getting vaccinated for influenza in lower numbers than they have in more than ten years.
- The vast majority of our respondents stated they would let their children get vaccinated for both the seasonal flu (93.3%) and COVID-19 (90%).
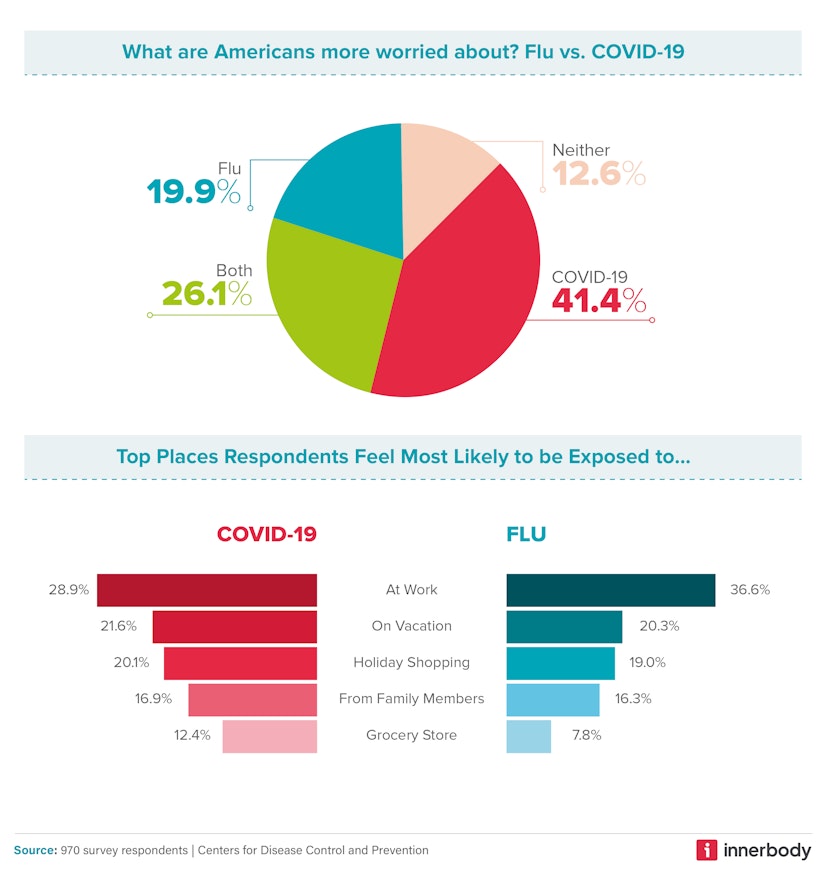
- More than twice as many people are worried about getting COVID-19 compared to the flu (41.4% vs. 19.9%).
- Gen Z is the generation most concerned (50%) about catching COVID-19, compared to Millennials (40.2%) and Gen X (39.9%).
- New Mexico currently has the most COVID-19 cases per 100,000 residents (209.1) and the third highest rate of influenza cases (90.8).
Survey overview
We wanted to know how COVID-19 has changed Americans’ perceptions of seasonal influenza. Specifically, we wanted to know if people are more worried about getting one or the other (and why) and if people are more likely to be vaccinated for one or the other.
To better understand how perceptions of the flu, COVID-19, and other respiratory viruses are formed, we analyzed state data from the Centers for Disease Control (CDC) on the number of monthly cases over the past few years of both the flu and COVID-19. We also gathered data on the prevalence of seasonal flu vaccines by age group. Finally, we surveyed 970 people about their opinions on COVID-19, the flu, and vaccines.

How do Americans feel about the flu?
In the face of an emerging “tripledemic” — RSV, seasonal flu, and COVID-19 — many U.S. hospitals are already reaching their reasonable limits for patient capacity. For example, in Orange County, California, the two primary children’s hospitals are struggling to keep up with cases of respiratory illness among children. ER wait times remain anywhere from 4-12 hours.
Our study found that more than twice as many people are worried about getting COVID-19 compared to the flu (41.4% vs. 19.9%). The plurality of our respondents (36.6% and 28.9%, respectively) believe they’ll catch the flu or COVID-19 at work, as opposed to on vacation or during their holiday shopping. Side-stepping the fear of getting sick may be another reason people working from home often feel less stressed than those who typically do not.
Of those who have opted not to get the flu vaccine, the majority (68.5%) stated it was because they believe themselves to be healthy and therefore do not need it. In comparison, the most common reason people chose not to get the COVID-19 vaccine is that they were concerned about side effects (62%).
The second most common reason our survey participants gave for not getting their annual flu shot was that they believed it was unsafe and would give them the flu (18.7%), followed by an almost equal number of people who simply don’t like injections (18.2%).
Vaccine hesitancy
When it came to survey participants’ trust in vaccine efficacy, 34.2% of our respondents claimed they did not get the COVID-19 vaccine because it doesn’t work, compared to 11.3% of respondents who felt the same about the seasonal flu vaccine. While apprehensions about the COVID-19 vaccine continue to spread across the country, the higher level of trust we uncovered regarding the flu vaccine could simply be due to people’s familiarity with the immunization.
According to a study conducted by the WHO, the four primary factors contributing to vaccine hesitancy are:
- Cultural reasons
- Perceived lack of need for vaccination
- Concerns over vaccine safety
- Lack of trust.
Of our participants who have not gotten or are not planning to get the COVID-19 or seasonal flu vaccines, the majority claimed to either be healthy or not need them or had little trust in their safety and efficacy.
However, because of its long association with negative health outcomes, the WHO has deemed vaccine hesitancy one of the biggest threats to global health in general. Each year, the global influenza vaccination program prevents approximately:
- 7.5 million influenza infections
- 3.7 million influenza-related medical appointments
- 105,000 influenza-related hospitalizations
- 6,300 influenza-related deaths
Despite their personal apprehensions about vaccines, the vast majority of our respondents stated they would let their children get vaccinated for both the seasonal flu (93.3%) and COVID-19 (90%).
The young and wary
When we asked participants if they were more worried about catching COVID-19, the flu, both, or neither, Gen Z was the generation most concerned (50%) about catching COVID-19, whereas Millennials (40.2%) and Gen X (39.9%) were slightly less concerned. Gen Z is the youngest generation and, therefore — hypothetically — the healthiest, but they also have had less time navigating a world without COVID-19.
Our Gen Z cohort was also the most concerned about catching the flu (25.3%) and had the lowest number of respondents claiming to be unconcerned about catching either (3.1%). Millennials (15%) and Gen X (13.1%) were both significantly less bothered by the idea of getting sick this winter.
According to a nationwide poll conducted by MTV and The AP-NORC Center for Public Affairs Research, more so than any other generation, Gen Z believes the COVID-19 pandemic has made it harder for them to pursue their goals, maintain their friendships, enjoy life, and manage their mental health. The majority of Gen Z respondents (65%) stated that education was an important part of their identity, while nearly half (46%) claimed that the pandemic made it more difficult for them to achieve their educational and career goals.
The fact that members of Gen Z appear to have been more negatively affected by the pandemic than Millennials or members of Gen X could very well be why this group is also the wariest of getting sick this flu season.
Weekly cases of seasonal flu and COVID-19

In late 2022 and early 2023, the U.S. has been experiencing more weekly influenza cases than it has in the past five years, with nearly 140,000 new cases a week according to data from the CDC. In December 2021, influenza infections peaked at approximately 114,000 per week, a high that had not been eclipsed since February 2020. The flu seems to have peaked a month early this winter, maxing out at around 186,000 cases in late November 2022, though we crested a new high as early as Halloween 2022 with about 139,000 cases. Yet (as you’ll see below), vaccine coverage continues to decline — particularly among children.
Weekly infections of COVID-19 reached a pandemic high in January 2022: approximately 5.6 million cases per week, more than doubling the peak number of cases in January 2021 (approx. 1.7 million per week) and more than ten times the current number of weekly cases (approx. 310,000 per week, the lowest number since mid-2020).
An early, difficult flu season
Flu season typically lasts between October and May, peaking in December and January; this year, however, it seems to have hit early (by about six weeks) and hard, bringing higher-than-average rates of illness. According to CDC estimates, at the time of writing, the 2022-2023 season has already had at least:
- 25 million cases of influenza
- 270,000 hospitalizations
- 17,000 flu-related deaths, including 85 children
Even though we seem to be past the peak, the U.S. has not experienced such a high flu-related burden since the 2009 H1N1 swine flu pandemic.
In late November, around the time flu cases reached their peak, vaccination numbers were lagging. About 128 million doses were distributed then, compared to 139 million for the 2021-2022 season and 154 million in 2020-2021. By mid-January 2023, the U.S. was up to about 171 million people who had received a flu shot. Not only have we caught up to our standard average vaccine distribution rate, but we’ve well exceeded these annual averages, meeting the demands of an unruly flu season.
Weekly cases of seasonal flu and COVID-19 by state
According to national reports, we’ve seen drastic improvements in COVID-19 case rates over the holidays. (Of course, testing and prevalence rates aren’t always the same — most people who take more convenient at-home tests don’t report their results to local government officials.)
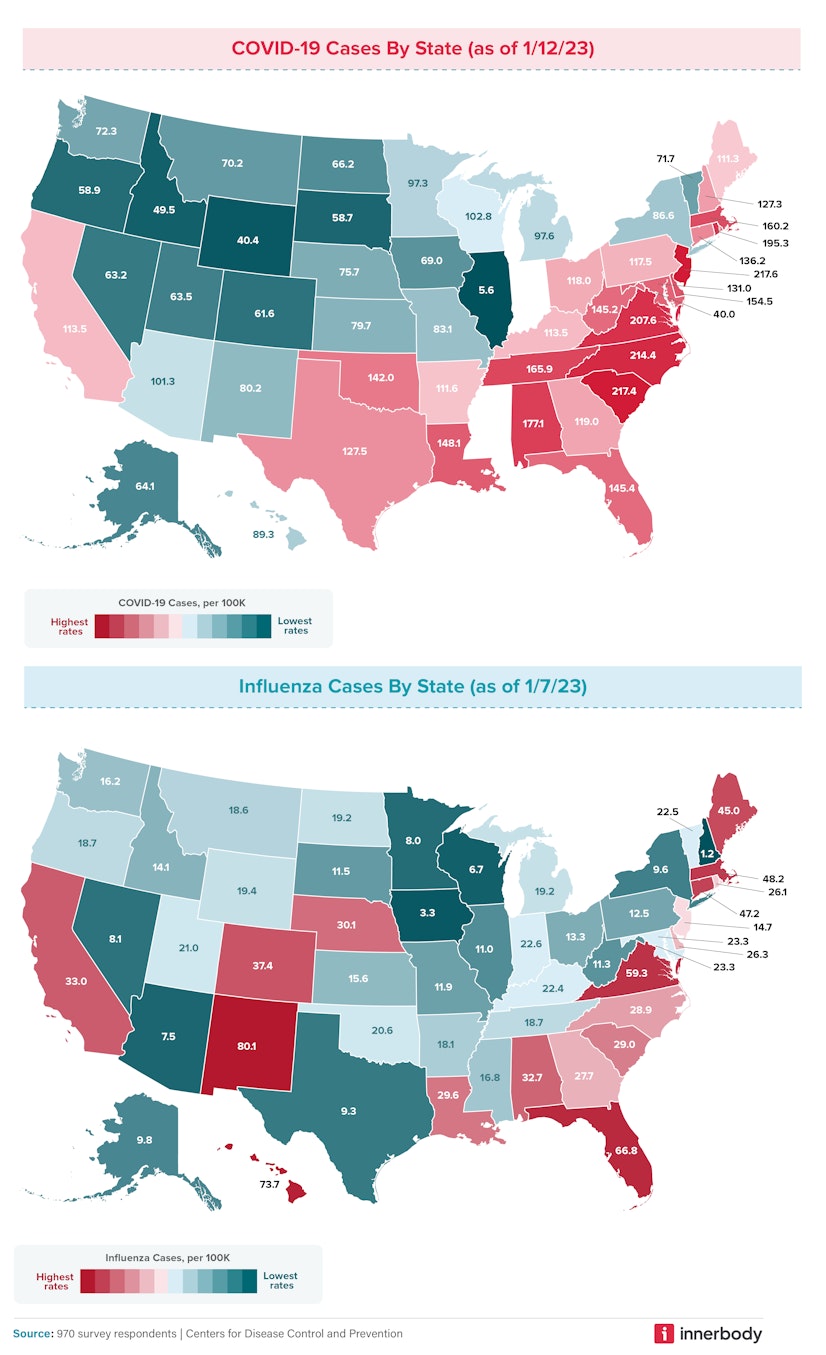
Since November 2022, we’ve seen dramatic improvements in COVID-19 rates in the central U.S., especially in Utah, the Dakotas, and Illinois, which went from having some of the highest rates before Thanksgiving to some of the lowest rates in January 2023. Now, the mid-Atlantic states and southeastern seaboard are experiencing the highest COVID-19 rates:
- New Jersey (217.6)
- South Carolina (217.4)
- North Carolina (214.4)
- Virginia (207.6)
- Rhode Island (195.3)
- Alabama (177.1)
- Tennessee (165.9)
- Massachusetts (160.2)
- Delaware (154.5)
- Louisiana (148.1)
Flu rates have changed less than COVID-19 rates over the holidays. The Southern states on our list — such as Alabama, Florida, and Virginia — still have some of the highest rates, though Alabama and Virginia’s numbers have halved. (Florida went from number eight on our list with 68.5 cases per 100,000 residents to number three with 66.8 cases.) The highest flu rates are scattered throughout the country, though we see more in the Northeast, with states like Massachusetts, Connecticut, and Maine entering the fray. Considering the Northeast ranked as some of the states who celebrate Christmas with the biggest displays of festivity, it’s possible there was more flu sharing than usual in the Northeast.
Here are the states with the most flu cases per 100,000 residents as of mid-January 2023:
- New Mexico (80.1)
- Hawaii (73.7)
- Florida (66.8)
- Virginia (59.3)
- Massachusetts (48.2)
- Connecticut (47.2)
- Maine (45.0)
- Colorado (37.4)
- California (33.0)
- Alabama (32.7)
Lowest infection rates
Early in flu season, we found an inverse relationship between COVID-19 and flu infection rates: states with the highest flu counts had the lowest numbers of positive COVID-19 tests and vice-versa. That relationship isn't as clear now that both flu and COVID-19 cases are dropping. Illinois has a dramatically lower COVID-19 case count than any other state at just 5.6 reported cases per 100,000 people, and they don’t make the top 10 states with high flu rates, either. In fact, none of the other nine states with the lowest COVID-19 rates are found in the top ten highest flu rates. Those states include:
- Illinois (5.6)
- Wyoming (40.4)
- Idaho (49.6)
- South Dakota (58.7)
- Oregon (58.9)
- Colorado (61.6)
- Nevada (63.2)
- Utah (63.5)
- Alaska (64.1)
- North Dakota (66.2)
We found the same separation in states with the lowest flu rates, including:
- New Hampshire (1.2)
- Iowa (3.3)
- Wisconsin (6.7)
- Arizona (7.5)
- Minnesota (8.0)
- Nevada (8.1)
- Texas (9.3)
- New York (9.6)
- Alaska (9.8)
- Illinois (11.0)
As of mid-January 2023, neither Illinois nor Alaska are experiencing much impact from either illness, whereas Virginia, Alabama, and Massachusetts are hit hard by both. While we previously proposed that people who catch one disease are more likely to stay home from work or isolate themselves from others, making them less likely to catch and spread the other, these new findings throw a wrench in our theory. Some states have roughly the same number of cases but rank significantly higher as everyone else heals; some states experienced more travel (and thus more potential exposure) than others over the holiday season. No matter the reason, these numbers are promising, suggesting that we may finally be getting better.
What’s the difference between the flu and COVID-19?
According to the Mayo Clinic, the most notable similarity between the flu and COVID-19 is that they are both caused by viruses. COVID-19 is caused by a coronavirus called SARS-CoV-2, while the flu is caused by influenza A and B viruses. Both infections also share some similar symptoms:
- Fever
- Cough
- Shortness of breath or difficulty breathing
- Tiredness
- Sore throat
- Runny or stuffy nose
- Muscle aches
- Headache
- Nausea or vomiting (more so in children than in adults)
Both COVID-19 and the flu can also occasionally lead to more serious complications, especially in older or more vulnerable populations, such as:
- Pneumonia
- Acute respiratory distress syndrome
- Organ failure
- Heart attacks
- Heart or brain inflammation
- Stroke
As far as differences go, COVID-19 appears to be contagious for a longer period and spreads more quickly than influenza A and B. After contracting COVID-19, you are more likely to experience a loss of taste or smell.
Currently, COVID-19 appears to be the more prevalent of the two ailments. While the gap is closing, the CDC found that the lowest infection rate of COVID-19 is a meager 5.6 cases per 100,000 people (in Illinois), while the lowest infection rate for the flu was 1.2 cases per 100,000 people (in New Hampshire).
Our study found that more than twice as many people are worried about getting COVID-19 compared to the flu (41. 4% vs. 19.9%). Still, more than a third of respondents (34.2%) also claimed they did not get the COVID-19 vaccine because it doesn’t work, compared to a much smaller percentage of people (11.3%) who felt the same about the flu vaccine. The fear of catching COVID-19, it would seem, is not a strong enough driver for many to get vaccinated against it, which could explain the higher prevalence of COVID-19 cases we are seeing this winter.
Who’s getting the flu vaccine?

In 2018, the rate of influenza A and B vaccinations fell in every age group, according to data from the CDC. The sharp decline experienced in 2018 was likely the result of two factors:
- The perceived ineffectiveness of that year’s vaccine
- A longer than average flu season, which lasted for 21 weeks (the longest in a decade) and was marked by two separate waves of influenza A infections
Vaccination rates for every age group recovered in 2019 and 2020. By 2021, however, the influenza A and B vaccination rates again began to fall for every age group except those 50 years or older. And by 2022, even the 50+ crowd started opting out of their annual flu shot.
Historically, adults between the ages of 18 and 49 have been less likely than any other age group to get their annual flu vaccine, a trend that has continued into 2022:
- 6 months to 4 years: 66.7%
- 5 to 12 years: 58.4%
- 13 to 17 years: 49.8%
- 18 to 49 years: 37.1%
- 50 to 64 years: 52.4%
- 65+ years: 73.9%
Leading up to 2020, babies and children (six months to four years old) were getting vaccinated at a higher rate than any other age group. As of late, however, they have been surpassed by individuals 65 and up. Babies and children up to age 12 are currently getting their flu shots at the lowest rates in more than ten years.
According to the U.S. Department of Health & Human Services (HHS), there are many important reasons why young people should continue to receive the standard recommended course of vaccinations:
- We’ve completely eliminated some diseases because of vaccines. Because of advances in medical science, children can be protected against more diseases than ever before. Some diseases that once injured or killed thousands of children have been eliminated completely, and others are close to extinction, primarily due to safe and effective vaccines.
- Vaccines are very safe and effective. They are only given to children after a long and careful review by scientists, doctors, and healthcare professionals. Vaccines can come with some discomfort — pain, redness, or tenderness at the site of injection — but this is minimal compared to the pain, discomfort, and trauma of the diseases these vaccines protect against.
- Immunizations protect everyone. Children in the U.S. still get vaccine-preventable diseases; there has been a resurgence of measles and whooping cough (pertussis) over the past few years. Getting fully immunized protects our immediate families and helps prevent the spread of preventable diseases to friends and loved ones.
- Immunizations can save parents time and money. A child with a vaccine-preventable disease can be denied attendance at schools or childcare facilities, and some vaccine-preventable diseases can result in prolonged disabilities, which can come with a heavy financial toll due to missed work, medical bills, or long-term care. Getting vaccinated against preventable diseases is a good investment — and is usually covered by insurance.
- Vaccinations protect future generations by reducing and, in some cases, eliminating many diseases that killed or severely disabled people just a few generations ago. For example, the smallpox vaccination eradicated that disease worldwide. Children today are no longer required to get smallpox shots because that disease no longer exists.
Methodology
We surveyed 970 people to find out whether Americans’ perceptions of seasonal influenza have changed because of the COVID-19 pandemic. Specifically, we wanted to know if people are more worried about COVID-19 or the flu, and if people are more likely to get vaccinated for one or the other. To acquire a better understanding of how certain perceptions are formed in various regions of the U.S., we also analyzed state data from the Centers for Disease Control (CDC) on the number of cases per month of both the flu and COVID-19 within the past few years and gathered data on the prevalence of seasonal flu vaccination among different age groups.
Fair use statement
Innerbody Research is committed to providing objective, science-based suggestions, and research to help our readers make more informed decisions regarding health and wellness. We invested time and effort into creating this report to analyze the differences in perception and opinion between influenza A and B (the seasonal flu) and COVID-19. Through our analysis, we sought to answer questions such as: “Are Americans more concerned about one virus over the other?” We hope to reach as many people as possible by making this information widely available. As such, please feel free to share our content for educational, editorial, or discussion purposes. We only ask that you link back to this page and credit the author as Innerbody.com.
Sources
World Health Organization. (2022, December 1). Joint statement - influenza season epidemic kicks off early in Europe as concerns over RSV rise and covid-19 is still a threat. World Health Organization. Retrieved December 18, 2022, from https://www.who.int/europe/news/item/01-12-2022-joint-statement---influenza-season-epidemic-kicks-off-early-in-europe-as-concerns-over-rsv-rise-and-covid-19-is-still-a-threat
Money, L. (2022, November 4). A 'tripledemic' of flu, RSV and Covid is feared in California. Los Angeles Times. Retrieved December 18, 2022, from https://www.latimes.com/california/story/2022-11-04/tripledemic-of-flu-rsv-and-covid-is-feared-in-california
Kumar, S., Shah, Z., & Garfield, S. (2022, September 13). Causes of vaccine hesitancy in adults for the influenza and covid-19 vaccines: A systematic literature review. Vaccines. Retrieved December 18, 2022, from https://www.ncbi.nlm.nih.gov/pmc/articles/PMC9503596/
AP-NORC Center for Public Affairs Research. . (2022, September 12). Gen Z and the toll of the pandemic - AP-NORC. AP. Retrieved December 18, 2022, from https://apnorc.org/projects/gen-z-and-the-toll-of-the-pandemic/
Centers for Disease Control. (2022, December 30.) Weekly U.S. influenza surveillance report. Retrieved January 5, 2023 from https://www.cdc.gov/flu/weekly/index.htm
Mayo Foundation for Medical Education and Research. (2022, October 11). Covid-19 vs. flu: What's the difference? Mayo Clinic. Retrieved December 19, 2022, from https://www.mayoclinic.org/diseases-conditions/coronavirus/in-depth/coronavirus-vs-flu/art-20490339
Scutti, S. (2019, June 20). Longer than usual and M-shaped: CDC says 2018-19 flu season was odd but not as severe as the previous deadly season. CNN. Retrieved December 19, 2022, from https://edition.cnn.com/2019/06/20/health/2018-19-flu-season-recap-cdc/index.html
Office of Infectious Disease and HIV/AIDS Policy (OIDP). (2022, May 6). Five important reasons to vaccinate your child. HHS.gov. Retrieved December 19, 2022, from https://www.hhs.gov/immunization/get-vaccinated/for-parents/five-reasons/index.html
Centers for Disease Control and Prevention. (2018, November 5). Estimates of influenza vaccination coverage among adults-United States, 2017–18 flu season. Centers for Disease Control and Prevention. Retrieved December 19, 2022, from https://www.cdc.gov/flu/fluvaxview/coverage-1718estimates.htm

Copyright © Innerbody Research 1997 - 2025. All Rights Reserved.
