The Top 10 U.S Metro Areas for Digital Nomads
Not every city is going to help you do your best work. Find out which metropolitan areas in the U.S. are most (and least) friendly for digital nomads.

In 2020, the number of full-time remote workers in the U.S. increased by nearly 50% (up to 11 million people); in 2021, that number increased to 15.5 million; by 2025, an estimated 35.7 million Americans (roughly 22% of the total workforce) will likely be working remotely. Boosted largely by the COVID-19 pandemic and enabled significantly by technology, an increasing number of people are leaning toward a more location-independent working life. And their numbers have grown enough for these tech-savvy travelers to have earned themselves the title “digital nomads.”
So what does a digital nomad need — besides coffee, a reliable Wi-Fi connection, and a place to set their laptop — to thrive in the remote-working world? After a detailed and lengthy analysis, we found the answer: not much. Where then, we asked, is the best (and worst) equipped to support a digital nomad in the U.S.?
We broke down the top 10 friendliest metro areas for digital nomads based on the number of large coffee chains, remote working locations, Internet coverage, and the average cost of rent to help you find your next favorite place to work.
Jump to:
Key takeaways
- Orlando, FL is the friendliest city for digital nomads in the U.S.
- 3 of the top 10 U.S. cities best suited for digital nomads are located in Florida.
- New York, NY ranked as the least friendly U.S. metro area for digital nomads.
- Las Vegas, NV has 26 Starbucks locations per 100,000 residents.
- New York (1,433), Massachusetts (1,082), and Florida (891) had the most overall Dunkin’ Donuts locations.
The best places in the country for digital nomads: an overview
The life of a digital nomad certainly sounds glamorous and carefree, but in the real world, constantly combining work and travel can be less idyllic than it sounds. Figuring out the housing or rental market of a new place — especially a new country — can be tricky. Internet speeds and availability of reliable Wi-Fi are also crucial factors to consider; in certain countries, Wi-Fi can be slow and hard to find, even in major cities.
You can’t overlook issues of legality, either. Are you legally allowed to work in your desired country? Do you need to acquire a special visa? Are there tax implications to consider? These may not be the most exciting aspects of the digital nomad life to consider — but they are likely to be the most crucial to one’s success.
For many, staying within the United States side-steps many of these problems. To determine which places in the U.S. are best suited to accommodate digital nomads, we analyzed data from the FCC, Census.gov, and other sources. Specifically, we looked at:
- Percentage of residents with access to at-home broadband services
- Median rent information
- Prevalence of public libraries per 100,000 residents
- Prevalence of Starbucks, Dunkin’ Donuts, and WeWork locations per 100,000 residents
After collecting data for over 900 U.S. cities, we limited our analysis to the top 100 based on population size. Then, for our final analysis, we generated a metascore for each city to determine the best suited for digital nomads.
The metascores used for our final rankings were weighted in the following breakdown:
- Prevalence of WeWork, Dunkin’ Donuts, and Starbucks locations per 100,000 people: 60%
- Median rental rates and percentage of residents with at-home broadband: 30%
- Prevalence of public libraries per 100,000 people: 10%

The 10 U.S. cities and states for digital nomads

For some, struggles finding the right technologies and places to stay might be enough to keep them working and living exclusively in the U.S. For others, it could be the limitations of the digital nomad visa, which can come with certain ambiguous employer-location and minimum-income requirements.
Most digital nomads working abroad do so while utilizing a standard tourist visa — a practice that varies from frowned upon to illegal, depending on the country you’re in. However, there are plenty of great places to work as a digital nomad here in the U.S.
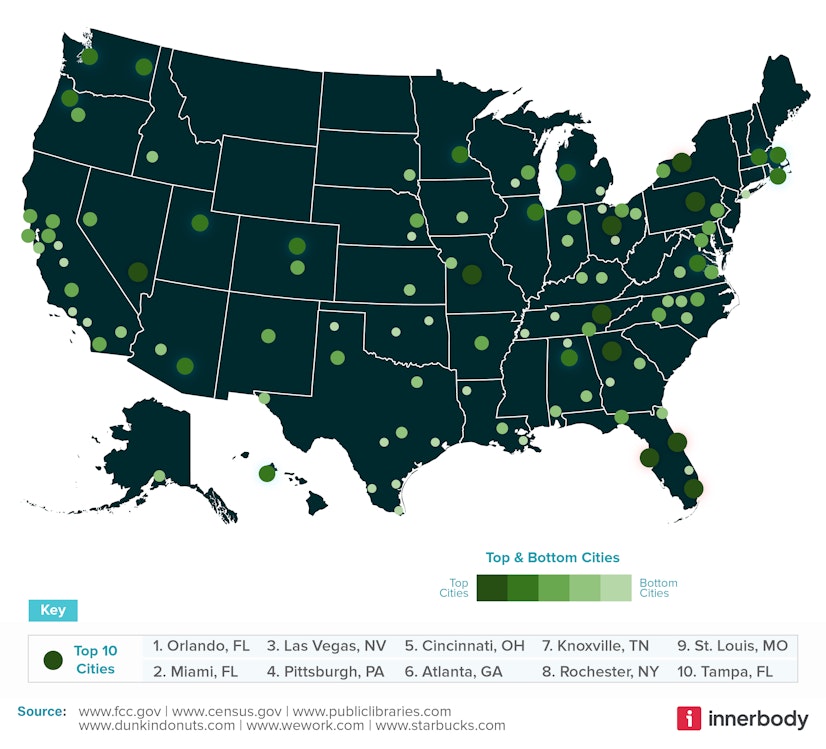
Based on our accessibility measurements, we determined that the top 10 cities in the U.S. for digital nomads are:
- Orlando, FL
- Miami, FL
- Las Vegas, NV
- Pittsburg, PA
- Cincinnati, OH
- Atlanta, GA
- Knoxville, TN
- Rochester, NY
- St. Louis, MO
- Tampa, FL
Despite the fact Florida has some of the highest median rental rates for a one-bedroom apartment in the country, three of the top 10 cities are located there: Miami ($1,273), Orlando ($1,187), and Tampa ($1,175). Florida must offer enough remote work-oriented amenities — like Starbucks, Dunkin’ Donuts, and public libraries — for digital nomads to hypothetically overlook the state’s above-average rent costs.
Soaring Florida rents
In February 2022, the median rent for studios, one- and two-bedroom apartments in the Miami metropolitan area spiked to $2,988 per month. Orlando’s median rental rate has increased by nearly 35% a year, while Tampa’s rent prices have shot up by 31%. In comparison, the median cost for similar-size apartments in New York has risen by 14% yearly to reach $2,750 per month.
The drastic increases in rent costs experienced by Florida’s largest cities could be due to the state’s continued population growth. In 2021, Florida acquired 211,000 new residents; at the same time, New York (400,000) and California (262,000) shed large quantities of theirs.
Despite these potential obstacles, Florida seems to be one of the friendliest places for digital nomads. Our study also found plenty of cities that were not as well-suited for remote workers. These 10 cities are the least supportive of digital nomads:
- New York, NY
- Brownsville, TX
- Laredo, TX
- Corpus Christi, TX
- Los Angeles, CA
- Detroit, MI
- Toledo, OH
- Oxnard, CA
- Columbus, GA
- New Orleans, LA
Except for the cluster near the top found in Texas, the least friendly cities appear to be dispersed somewhat evenly throughout the U.S. The lower overall metascore for these cities could be partially due to the high cost of living and a lower prevalence of amenities useful to digital nomads. For example, three of the 10 cities on this list are located in two of the priciest areas of the country: Southern California and New York City.
For some context, here’s the availability of amenities a digital nomad might need (per 100,000 people) in Los Angeles:
- WeWork (0.16)
- Dunkin’ Donuts (0.34)
- Starbucks (4.18)
- Public libraries (1.45)
And the same features in New York:
- WeWork locations (0.35)
- Dunkin’ Donuts (0.84)
- Starbucks (0.97)
- Public libraries (0.22)
Now, compare those findings to the amenities available in our number one city, Orlando:
- WeWork (0)
- Dunkin’ Donuts (16.17)
- Starbucks (23.29)
- Public libraries (3.88)
Clearly, we can see a significantly higher prevalence of valuable amenities and alternative workspaces in Orlando (not including WeWork locations, of which there were none). In our study of the most and least stressful states to work in, Florida ranked 35 out of 50. Perhaps the Sunshine State’s wealth of amenities remote workers need also makes it a less-stressful place to work and, therefore, more attractive to digital nomads.
Most and least friendly states for digital nomads
Despite three of its cities making it into our top 10, Florida itself did not make the cut for the top 10 most friendly states for digital nomads. Most of the states on our top 10 list are located in the country's northeast corner, while the rest — save for Alaska, Iowa, and Illinois — are located just down the coast.
We found that the 10 best states for digital nomads are:
- New Hampshire
- Maine
- Vermont
- Massachusetts
- Connecticut
- Rhode Island
- Alaska
- District of Columbia
- Iowa
- Illinois
One could argue that the prominence of East Coast and Northeastern states on this list is due to the higher-than-average number of Dunkin’ Donuts, Starbucks, and public library locations per 100,000 residents in these areas. For example, Vermont (30.2), Maine (22.7), and New Hampshire (17.3) were found to be among the top 10 states for the prevalence of public libraries; Iowa (18.2) and Alaska (15.6), too, have more than the average number of public libraries.
When looking specifically at the 10 states with the fewest number of public libraries per 100,000 people, we found that only Ohio (2.16) was also in the bottom 10 states for digital nomads overall. Considering that only 10% of our total metascore came from public library access, it’s likely that the lack of the other amenities we measured was more of a factor in determining the rankings for our bottom 10 states. Those states are:
- Utah
- Oklahoma
- Texas
- Louisiana
- Kentucky
- Alabama
- Arkansas
- Mississippi
- Ohio
- Michigan
As far as WeWork locations, we found every state in the bottom 10 had less than 0.15 locations per 100,000 people. When it came to Dunkin’ Donuts franchises, we found only Michigan (1.08), Ohio (2.1), and Alabama (1.21) to have more than one location per 100,000 people. And, as could be expected, not one state in the bottom 10 had more than 4.5 Starbucks locations per 100,000 people — about half as many as the states with the most locations: Washington D.C. (9.7), Washington State (9.6), and Nevada (8.9).
The coffee shop effect
Our analysis focused on two of the biggest names in coffee shop chains: Starbucks and Dunkin’ Donuts. Despite the regionality of these chains, they’re both common to find nationwide, and we saw that many digital nomads flock to their reliability. Some of the most creatively successful people in history got much of their work accomplished in coffee shops: Pablo Picasso, JK Rowling, Simone de Beauvoir, Jean-Paul Sartre, and Bob Dylan, to name just a few. The external stimuli common to popular coffee joints — background chatter or soft music, casual crowds, and constantly changing visuals — stimulate our creativity that our traditional and home offices do not.
The right amount of noise is thought to enhance sensory signals and improve performance: a phenomenon called “stochastic resonance,” originally observed in animals. Researchers believe the constantly shifting combination of people, aromas, and daylight found in most coffee shops contributes to increased focus and creativity — relatively unrestricted access to a range of caffeine delivery modes likely helps, too.
Top 100 friendliest cities for digital nomads
Just knowing the top 10 cities you could travel to while working doesn’t always cut it: maybe you live in Florida, or you’ve been there and want to continue expanding your horizons. To help you plan your next move, we’ve put together a chart with the 100 friendliest cities for digital nomads below.
Surprisingly, New York and Los Angeles ended up at the bottom of our list of the cities best suited for digital nomads. But this, we determined, was the case for several reasons: high population density and high rental rates, with fewer Dunkin’ Donuts and Starbucks locations per 100,000 residents.
Cities known to offer more support to the tourism industry, corporate offsite events, and industry conventions — such as Orlando, Miami, and Las Vegas — ended up at the top of our list. The ready access to these useful amenities, including coffee shops and public libraries, likely allows residents and digital nomad transplants to take advantage of all the free amenities originally intended for out-of-towners.
Pittsburg, PA was lacking the more clearly defined benefits of cities like Orlando, Miami, and Las Vegas but still landed at number 4 on our top 100 list. In terms of amenities per 100,000 people, Pittsburg landed near the top for the number of Dunkin’ Donuts (8.32) and Starbucks (15.64) locations; it did not, however — along with 70 of the other cities on our top 100 list — have a single WeWork location.
Solidifying Pittsburgh's standing in the top five, we concluded, were two key factors:
- More public libraries per 100,000 people (11.98) than any other city on our list
- Low average median monthly rent ($927)
In comparison, you’d pay more than twice for rent in San Francisco, CA ($2,111), San Jose, CA ($2,159), and Port St. Lucie, FL ($1,964) than in Pittsburgh.
The broadband non-effect
On the list of our overall top 10 friendliest cities, only one (Tampa, FL) also ended up among the top 10 cities with the most broadband availability (judged by the percentage of residents with one or more broadband internet providers). Those cities are:
- Chattanooga, TN (85.6%)
- Lexington, KY (83.6%)
- Fort Wayne, IN (78.3%)
- Honolulu, HI (73.9%)
- Toledo, OH (73.4%)
- Lubbock, TX (73.3%)
- Kansas City, MO (72.1%)
- Cincinnati, OH (71.5%)
- Tampa, FL (70.7%)
- Nashville, TN (68.7%)
We noticed, too, that none of the cities on our overall bottom 10 list also appeared among the bottom 10 cities for broadband availability:
- Providence, RI (0.0%)
- Worcester, MA (0.01%)
- Tucson, AZ (0.02%)
- Virginia Beach, VA (0.02%)
- Washington, DC (0.38%)
- Philadelphia, PA (0.39%)
- Buffalo, NY (0.45%)
- Phoenix, AZ (0.65%)
- Spokane, WA (0.96%)
- Richmond, VA (1.24%)
As it would seem, the prevalence of at-home broadband services (that accounted for 30% of each city’s total metascore) did not affect their overall standing.
Not that it would have significantly altered our findings, but broadband internet subscriptions are in decline for the first time. For a decade now, according to Forbes, cable companies have been losing millions of subscribers as streaming services continue their domination of the home entertainment market. Broadband subscriptions, however, continued to grow.
But in the second quarter of 2022, Comcast and Charter, the two largest cable companies in the U.S., both reported a drop in broadband subscribers. This first-time exodus of customers resulted in a dip in stock prices for both companies. After a huge increase in new broadband connections during the pandemic, the market could be balancing itself out. The drop in customers could also be attributed to fewer people requiring new broadband subscriptions, as fewer Americans reportedly moved and changed their addresses this past year.
Most and least friendly cities by category

After finding our top picks overall, we wanted to see if the specific kind of public venue we analyzed made a difference in each top (and bottom) 10 list. One of the first trends we noticed was that Florida has a city in each category — occasionally more than one — which is consistent with our findings thus far: Florida appears to be an excellent place for digital nomads.
We’ll lay out our most (and least) well-rounded U.S. cities in terms of their Dunkin’ Donuts, Starbucks, WeWork, and public library third-space capacities below.
Dunkin’ Donuts
With 207 locations, Chicago had the most Dunkin' Donuts franchises overall. Because of its large population, though — about 2.7 million people — the Windy City didn't even make the top 10 list for Dunkin' Donuts locations per 100,000 people, which includes:
- Orlando, FL (16.2)
- Rochester, NY (13.3)
- Providence, RI (13.2)
- Worcester, MA (13.1)
- Miami, FL (9.3)
- Tampa, FL (9)
- Cincinnati, OH (8.7)
- Boston, MA (8.7)
- Pittsburgh, PA (8.3)
- Philadelphia, PA (8.3)
We also found many cities that, sadly, did not have a single Dunkin' Donuts location:
On this list are two of Washington's major cities, Seattle and Spokane, which isn't that surprising due to the Evergreen State's overwhelming number of Starbucks locations. Along with Idaho, North Dakota, Montana, Oregon, and South Dakota, there are no Dunkin' Donuts shops in Washington, leaving Starbucks to reign supreme.
Starbucks
Following the same trend we saw with Chicago and Dunkin’ Donuts, New York was found to have the most Starbucks locations overall (193). However, because of its population size — almost 20 million people — it did not make the top 10 list for Starbucks locations per 100,000 people. In fact, New York has less than one Starbucks (0.97) for every 100,000 residents, earning it a spot at the very bottom of the list for this metric.
The top 10 cities for Starbucks locations per 100,000 people are:
- Las Vegas, NV (26)
- Orlando, FL (23.3)
- Miami, FL (20.5)
- St. Louis, MO (17.7)
- Seattle, WA (17.6)
- Cincinnati, OH (17.2)
- Spokane, WA (17)
- Minneapolis, MN (15.8)
- Grand Rapids, MI (15.7)
- Pittsburgh, PA (15.6)
On the opposite end of the spectrum — with 168 locations — Las Vegas leads in the number of Starbucks locations per 100,000 people. This likely contributed to its prominent number three position on our overall top 10 list of friendly cities.
However, Las Vegas’ cozy relationship with Starbucks could be changing, given one location’s recent petition filed with the National Labor Relations Board to unionize with Starbucks Workers United. Many licensed Starbucks locations in Las Vegas are currently unionized with Culinary Workers Union Local 226, which encompasses more than 500 workers on the Las Vegas Strip, in downtown Las Vegas, and at Harry Reid International Airport. This store would be the first corporate (company-owned) store in Nevada to unionize.
Public libraries
Just two of the top 10 cities for the number of public libraries overall — Pittsburgh, PA (36) and Baltimore, MD (32) — also made it on the top 10 list of public libraries per 100,000 residents:
- Pittsburgh, PA (12)
- Birmingham, AL (10.6)
- Rochester, NY (9)
- St. Louis, MO (8.9)
- Knoxville, TN (8.8)
- Miami, FL (6.6)
- Shreveport, LA (6)
- Grand Rapids, MI (5.6)
- Baltimore, MD (5.6)
- Atlanta, GA (5.4)
The relatively small populations of both Pittsburg (300,431) and Baltimore (576,498) are likely responsible for their appearance on the list above, and why cities with much larger populations and many more libraries, such as Chicago, IL (84), Los Angeles, CA (56), Philadelphia, PA (55), and New York, NY (44), didn’t make the list.
The 10 cities with the fewest public library locations are:
- Columbus, OH (0.11)
- Houston, TX (0.13)
- San Antonio, TX (0.14)
- New York, NY (0.22)
- Dallas, TX (0.23)
- Cleveland, OH (0.27)
- Toledo, OH (0.37)
- Modesto, CA (0.46)
- Akron, OH (0.53)
- Cincinnati, OH (0.65)
Cities in Ohio make up half of the list above. However, Ohio has 255 libraries, putting it right about the middle of the list. Texas, too, has 648 public libraries overall, but three of its major cities appear on the list above. Again, we can safely assume that the larger populations of both Ohio (11,780,017) and Texas (29,527,941) play a role here.
WeWork
During our analysis, we found that 70 of our top 100 cities had zero WeWork locations. We also found the city with the most locations, New York, had more than four times the locations (70) of its closest rival, Boston (14). Because of its massive population, though, New York did not make it on your top 10 list for WeWork locations per 100,000 people:
- Boston, MA (2.1)
- Atlanta, GA (1.6)
- San Francisco, CA (1.4)
- Miami, FL (1.1)
- Washington, DC (1)
- Salt Lake City, UT (1)
- Denver, CO (0.84)
- Seattle, WA (0.82)
- Austin, TX (0.73)
- Minneapolis, MN (0.71)
Most and least friendly states by category

When we broke down our analysis by state by category, we discovered some interesting trends: the East Coast clearly favored Dunkin’ Donuts, while Starbucks dominated on the West Coast. We also found that most of the states with the highest number of public libraries all appeared to be clustered together in the Northeast and Midwest regions of the country. And as far as WeWork locations, those were significantly less prevalent and only seemed to have taken hold in New York.
Dunkin’ Donuts
The East Coast, as expected, dominated the top 10 list for Dunkin’ Donuts locations per 100,000 people:
- New Hampshire (15.7)
- Massachusetts (15.5)
- Rhode Island (14.6)
- Connecticut (13.5)
- Maine (11.6)
- New Jersey (9.5)
- Vermont (7.6)
- New York (7.2)
- Delaware (6.7)
- Illinois (5.6)
New York (1,433), Massachusetts (1,082), and Florida (891) had the most overall locations. Florida, however, did not make it on the top 10 list for locations per 100,000 residents. This could be due to Florida’s slightly larger population size (21,781,128) or the fact that unlike the other states on this list — including New York and Massachusetts — Florida had nearly as many Starbucks locations (825).
The bottom 10 states for Dunkin’ Donuts locations per 100,000 people were primarily on the West Coast, Midwest, and Alaska, where Starbucks generally reigned.
- Washington (0)
- Oregon (0)
- Idaho (0)
- Montana (0)
- South Dakota (0)
- North Dakota (0)
- Utah (0.03)
- Wyoming (0.17)
- Alaska (0.27)
- Arkansas (0.3)
California, which would have been number 11 on this list — with just 0.34 locations per 100,000 people — actually has 135 locations overall but didn’t make the cut for this list because of its enormous population (39,237,836). California’s 135 locations, though, still account for an impressive presence. Until it made a massive comeback in 2015, Dunkin’ Donuts had only opened one store in the Golden State since its founding in 1950, which closed in 2002.
Starbucks
Washington D.C. and Washington state were at the very top of our top 10 list of states with the most Starbucks locations per 100,000 residents, both with close to ten:
- District of Columbia (9.7)
- Washington (9.6)
- Nevada (8.9)
- Colorado (8.5)
- Oregon (8.2)
- California (7.7)
- Hawaii (7.6)
- Arizona (7.5)
- Alaska (7.1)
- Virginia (5.6)
The only other East Coast state, besides the District of Columbia, to make this list was Virginia, which has 481 Starbucks locations overall. At number one on this list, Washington D.C. has just 65 Starbucks locations — but those are distributed throughout a population of just 670,050 people. California, on the other hand (number six on the list above), has more than 3,000 total locations, shared amongst a population of close to 40 million.
The lowest 10 states for Starbucks locations per 100,000 people were limited exclusively to the South, East Coast, and Midwest regions of the country:
- Mississippi (1.5)
- Vermont (1.7)
- Alabama (2.2)
- Maine (2.3)
- Louisiana (2.4)
- Arkansas (2.4)
- West Virginia (2.5)
- Rhode Island (2.6)
- Oklahoma (2.6)
- North Dakota (2.7)
Rhode Island and Vermont also appeared on the top 10 list for Dunkin’ Donuts locations, making the preference perfectly clear. At the same time, several other states — Mississippi, Alabama, Louisiana, Arkansas, West Virginia, Oklahoma, and North Dakota — were also found to have very few, if not zero, Dunkin’ Donuts locations. Perhaps due to their lack of both chain coffee shops, none of these other states made it on the top 10 list for states overall.
Public libraries
Other than Alaska, the top 10 states for the number of public libraries per 100,000 residents split into two clusters: the Midwest and the Northeast.
Those states were:
- Vermont (30.2)
- Maine (22.6)
- Iowa (18.2)
- New Hampshire (17.4)
- South Dakota (16.8)
- Alaska (15.6)
- Nebraska (15.5)
- Kansas (13.7)
- Wyoming (12.8)
- North Dakota (12.1)
As we have already seen, population size was a significant factor in the rankings for public libraries as well. New York and California, for example, have 1,080 and 1,146 public libraries, respectively, while Vermont only has 195, but because of Vermont’s drastically smaller population (645,570), there are more libraries to go around. The same holds true for Maine (1,372,247) and Iowa (3,193,079).
The 10 states with the fewest public libraries per 100,000 people were:
- Ohio (2.2)
- Texas (2.2)
- Florida (2.4)
- California (2.9)
- Nevada (2.9)
- Arizona (3.1)
- Maryland (3.2)
- New Jersey (3.3)
- Delaware (3.6)
- Hawaii (3.6)
Ohio has 255 public libraries and a population of less than 12 million, which is likely why it landed above Texas, Florida, and California, which all have more libraries overall but also have much larger populations. Sneaking into the top five on this list with just 92 public libraries was Nevada, which has a total population of 3,143,991.
WeWork
The prevalence of WeWork locations across the U.S. pales compared to that of America’s most-beloved coffee shops. Unlike Starbucks and Dunkin’, the top 10 states for WeWork locations were spread out a bit more evenly across the country:
- District of Columbia (1)
- New York (0.38)
- Massachusetts (0.22)
- California (0.14)
- Colorado (0.12)
- Utah (0.12)
- Washington (0.1)
- Illinois (0.09)
- Georgia (0.08)
- Nevada (0.06)
The only discernible cluster was on the East Coast, which included three states with relatively high numbers for WeWork locations overall: New York (76), Massachusetts (15), and the District of Columbia (7).
New York’s numbers and position aren’t surprising, given that WeWork was born in the SoHo neighborhood of New York City in 2010. Since then, however, the company hasn’t thrived as its founders once hoped. After several years of revenue growth and expansion, the company lost its footing and began to lose money. Despite the financial bailout they received in 2019, the co-working company is still on the verge of collapse.
Since the end of 2018, WeWork has lost more than $12 billion, and as of November 2022, they plan to close roughly 40 “underperforming” U.S. locations. This could be why 28 states are yet to open a single WeWork location:
Methodology
By analyzing data from the FCC on the percentage of residents with access to at-home broadband services, median rent information from Census.gov, the prevalence of public libraries per 100,000 residents, and the prevalence of Starbucks, Dunkin’ Donuts, and WeWork locations per 100,000, we created a meta-ranking system to determine which cities and states were best suited to accommodate digital nomads. After collecting data for over 900 U.S. cities, we limited our analysis to the top 100 based on population size. Then, for our final analysis, we generated a metascore for each city to determine which ones were the best suited for digital nomads.
Fair use statement
Innerbody Research is committed to providing objective, science-based suggestions, and research to help our readers make more informed decisions regarding health and wellness. We invested the time and effort into creating this report to determine which metropolitan areas of the U.S. are best suited for digital nomads, which is especially important during a time when this lifestyle is becoming more prevalent. We hope to reach as many people as possible by making this information widely available. As such, please feel free to share our content for educational, editorial, or discussion purposes. We only ask that you link back to this page and credit the author as Innerbody.com.
Sources
Castrillon, C. (2022, October 12). Why the Digital Nomad Lifestyle is on the rise. Forbes. Retrieved November 24, 2022, from https://www.forbes.com/sites/carolinecastrillon/2022/07/17/why-the-digital-nomad-lifestyle-is-on-the-rise/?sh=58c2de4c4934
Want to be a digital nomad? Here's what you need to know about remote working. Lonely Planet. (2022, August 3). Retrieved November 28, 2022, from https://www.lonelyplanet.com/articles/how-to-digital-nomad-remote-work
Visa Guide World. (n.d.). Digital Nomad visa - countries offering visas for Digital Nomads. VisaGuideWorld. Retrieved November 24, 2022, from https://visaguide.world/digital-nomad-visa/
Algar, S. (2022, April 14). Miami apartment rents skyrocket by 57 percent during Blue State Exodus. New York Post. Retrieved November 24, 2022, from https://nypost.com/2022/04/14/miami-apartment-rents-spike-57-percent-amid-blue-state-exodus/
Lufkin, B. (2021, January 20). Why you're more creative in coffee shops. BBC Worklife. Retrieved November 25, 2022, from https://www.bbc.com/worklife/article/20210114-why-youre-more-creative-in-coffee-shops
Adgate, B. (2022, August 10). Cable broadband subscribers drop for the first time. Forbes. Retrieved November 25, 2022, from https://www.forbes.com/sites/bradadgate/2022/08/09/cable-broadband-subscribers-drop-for-the-first-time/?sh=495f3f1458ef
DeSilva, K. (2022, November 15). Starbucks store plans to unionize in Las Vegas. Nevada Public Radio. Retrieved November 28, 2022, from https://knpr.org/knpr/2022-11/starbucks-store-plans-unionize-las-vegas
Rotunno, T., & Belvedere, M. J. (2013, January 16). Dunkin' Donuts return to California a 'no brainer:' CEO. CNBC. Retrieved November 28, 2022, from https://www.cnbc.com/id/100383617
Eavis, P. (2022, November 10). WeWork will close about 40 locations as losses narrow. The New York Times. Retrieved November 28, 2022, from https://www.nytimes.com/2022/11/10/business/wework-quarterly-earnings.html

Copyright © Innerbody Research 1997 - 2025. All Rights Reserved.
