How Do States Rank in Crimes Against Persons?
Vermont overtakes New Jersey as the safest state, while New Mexico surpasses Nevada as the most dangerous.

More than half of all U.S. adults (58%) feel that reducing crime should be a top priority for the government.1 However, while crime rates have drastically dropped over the past 30 years, Americans consistently report feeling like crime is on the rise.2 This could be due to notable spikes in violent crime over the years, such as in 2020, when the U.S. saw its largest single-year increase (30%) in murders.3
But how common are violent crimes and other crimes against persons in the United States? Which states are the safest, and which are the most dangerous? To answer these questions and others, we analyzed crime statistic data from the FBI's National Incident-Based Reporting System (NIBRS) to rank states across the country.
Jump to:
Key takeaways
- New Mexico has the country's highest rate of crimes against persons, while Vermont has the lowest.
- Assault offenses accounted for 92.2% of the nearly 3.5 million reported crimes against persons in 2022.
- The South has the highest rate of assault and homicide crimes, while the Central U.S. is struggling with human trafficking and sex offense crimes.
- The East Coast has the lowest rate of crimes against persons, with Delaware being the only state in the region to be in the top 10 Assault and Homicide crimes list, despite the state’s recent gun safety legislation.
- Minnesota, West Virginia, Wisconsin, California, and Iowa are new states on this year's safe list, while Louisiana, Michigan, and Kansas are newcomers to the dangerous list.
Overview
For the 2024 update of our study on crimes against persons across the U.S., we used the latest data from the FBI's National Incident-Based Reporting System (NIBRS), which includes statistics up to the year 2022.
The FBI’s Uniform Crime Reporting (UCR) Program has provided crime statistics since 1930 and relies on the voluntary participation of law enforcement agencies nationwide to generate reliable crime data and reveal trends.
In January 2021, the UCR Program transitioned to exclusively using NIBRS, a more comprehensive data collection system. NIBRS gathers detailed information on each crime incident and its offenses, categorized into crimes against persons, crimes against property, and crimes against society.
This study focuses on crimes against persons reported through NIBRS in 2022 and uses that data to rank the most and least dangerous states across the U.S.

National participation in crime reporting
The data provided by the FBI’s Uniform Crime Reporting (UCR) Program has become one of the country’s leading social indicators. For example, earlier this year, President Biden released a statement referencing an overall decrease in violent crimes based on preliminary data provided by the FBI’s UCR Program.4 Crime is one of the top cultural issues impacting voters' opinions for the 2024 election, and this data is being used to discuss the status of crime in the country.5
However, law enforcement agency participation rates vary widely by state, and a quarter of the country’s population wasn’t accounted for in 2022. This means that, while the information is still very valuable, the FBI’s crime data is incomplete and can’t paint an entirely accurate picture of the status of crime.
According to the 2022 UCR participation data available through the FBI’s Crime Data Explorer, 22,113 law enforcement agencies across the 50 U.S. states participated, but only 13,295 — or 60.1% — of them reported crime data through the NIBRS.6 That 60.1% of agency participation covers just over 75% of the national population. But it turns out that some states are far better at reporting than others. The chart below illustrates how agency participation varies by state. States with higher agency participation generally cover more of the population, though there is some noteworthy variation.

Created by Innerbody Research
According to UCR participation data for 2022, the five states that performed the best in agency participation to report crime data were:
- Rhode Island (96%)
- Oklahoma (89.7%)
- Virginia (89.1%)
- Oregon (88.0%)
- New Hampshire (86.9%)
And the five states that performed the worst in agency participation to report crime data were:
- Pennsylvania (7.1%)
- Florida (8.8%)
- New York (16.5%)
- West Virginia (45.3%)
- Louisiana (47.0%)
The difference in agency participation and subsequent population coverage among states is staggering. A vast majority of U.S. states covered at least 50% of their population in their crime reporting. Notably, West Virginia and Louisiana — states with some of the worst rates of agency participation in data reporting — still contribute data covering much more than 50% of their populations (effectively covering a larger share of their population than states like California, Alaska, Mississippi, and New Jersey). Only Pennsylvania, Florida, and New York fall under the 50% population coverage mark, with less than 20% agency participation. In our previous version of this study, Florida wasn’t included because the state did not report any crime data to the FBI for the specified time period.
What is a crime against persons?
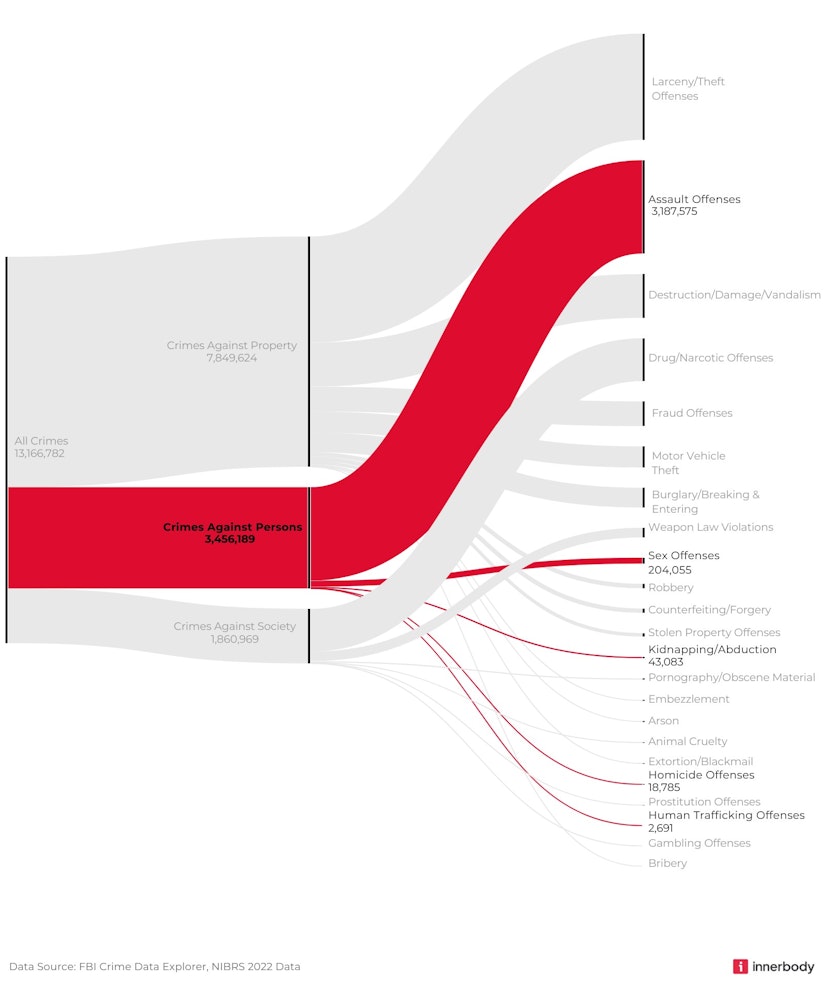
In 2022, the law enforcement agencies that participated in the National Incident-Based Reporting System (NIBRS) program reported 13,166,782 total offenses. Of these, 3,456,189 offenses were considered crimes against persons.
Created by Innerbody Research
A crime against persons is any crime where the victims “are always individuals.” For each incident reported through the NIBRS, there may be one or more offenses (a new offense is counted for each victim harmed).7
Crimes against persons include the following offenses:7
Assault offenses
This includes aggravated assault, simple assault, and intimidation. These are the most common crimes against persons by far, totaling over three million incidents in 2022.
Sex offenses
While sex offenses were previously divided into forcible and nonforcible offenses, the FBI began publishing them in the same category starting in 2018. Sex offenses include rape, sodomy, sexual assault with an object, fondling, incest, and statutory rape.
As different states have different ages of consent, the details of the laws surrounding statutory rape vary by state as well.8 However, no matter the age of consent, statutory rape is always defined as “an act of sexual intercourse with a person under the age of consent.” Some jurisdictions may use different terms to describe statutory rape, such as corruption of a minor (COAM), unlawful sex with a minor (USWAM), and others, but the definition remains the same.9
Kidnapping or abduction
While both kidnapping and abduction sound like similar crimes, the former involves “unlawful restraint of a person’s liberty by force or show of force,”10 while the latter is defined as “the taking of a person against their will” through force, persuasion, or fraud.11 Some states may require the victim to be a child for the crime to be defined as an abduction, while others consider abduction and child abduction to be separate crimes.11
Homicide offenses
Homicide offenses include murder and nonnegligent manslaughter, negligent manslaughter, and justifiable homicide. The definition of “justifiable” varies by state but often includes acting in self-defense.12 As explained by Cornell Law School, “A justifiable homicide absolves the actor of any criminal liability.”13
Human trafficking offenses
While reported separately from sex offenses, human trafficking offenses include commercial sex acts and involuntary servitude. Though the FBI considers prostitution offenses as crimes against society instead of crimes against persons,7 the federal definition of prostitution is when someone obtains or provides “any commercial sex act.”14
Note: If you believe you or someone you know may be a victim of human trafficking, you are not alone — help is available.
- National Human Trafficking Hotline | The Administration for Children and Families
- Report Human Trafficking | Homeland Security
- CyberTip Report | Report Child Sexual Exploitation Online
- Call the National Human Trafficking Hotline at 1-888-373-7888 or text HELP to 233733 (BEFREE)
Which U.S. states are the safest and most dangerous?
Here is a map ranking U.S. states based on the rate of crimes against persons.

Created by Innerbody Research
For both the safest and most dangerous states in the U.S., last year’s runner-ups have claimed the top spots. New Mexico has overtaken Nevada as the most dangerous state, while New Jersey took the crown from Vermont for being the safest state.
Here are the top 10 safest states in the U.S. based on the rate of reported crimes against persons:
- Vermont
- New Jersey
- Rhode Island
- Connecticut
- Minnesota
- West Virginia
- Wisconsin
- California
- Maine
- Iowa
The top 10 most dangerous states, or the ones with the highest rate of crimes against persons, include:
- New Mexico
- Arkansas
- Nevada
- Tennessee
- South Carolina
- Louisiana
- Michigan
- Kansas
- Alabama
- South Dakota
Overall, the East Coast, in general, has continued to have the lowest rate of crimes against persons in the U.S., with the South seeming to struggle the most.
The South’s issue with violent crime may be due to gun laws. According to the Giffords Law Center’s Annual Gun Law Scorecard, a majority of southern states received an “F” in gun safety, with the highest grade being a “C-” for North Carolina. Five of the states with an “F” grade made our top 10 most dangerous states list, including:15
- Arkansas (2nd place)
- Tennessee (4th place)
- South Carolina (5th place)
- Louisiana (6th place)
- Alabama (9th place)
Louisiana is also a newcomer to the dangerous list this year. This state has the second-highest gun death rate in the country, which experts feel can be attributed to a lack of gun control laws and high rates of gun ownership.16 Additionally, in 2022, Louisiana lawmakers introduced a law (Act 680) that allows current and former military personnel to carry concealed guns without a permit.17
In comparison, two of the newcomers to the safe list — Minnesota and California — introduced new gun safety laws in the same year.
- Minnesota enforced the regulation of “ghost guns”18
- Governor Newsom of California signed legislation involving gun possession and regulating the sale of firearms19
However, two other newcomers to the safe list — West Virginia and Iowa — have more lenient gun laws. Iowa lawmakers, for example, passed a law in 2021 that allows citizens to purchase and carry handguns before getting a permit.20
With gun deaths among U.S. teens and children seeing a 50% uptick between 2019 and 2021,21 and over half (59%) of public K-12 teachers reporting being at least “somewhat worried” about the possibility of a school shooting, the way states respond and adjust their laws in the coming years could greatly impact their safety rankings.22
Most common crimes against persons by state
In order to provide a better picture of which crimes against persons are most common across the United States, we broke down the FBI’s data into two categories:
- Assault and homicide offenses
- Human trafficking, kidnapping, abduction, and sex offenses
The top and bottom 10 states based on assault and homicide crime rates are shown in the chart below, with the numbers reported as a rate per 10,000 people.

Created by Innerbody Research
Perhaps unsurprisingly, a majority of the top 10 states with the highest assault and homicide rates can also be found on our top 10 most dangerous states list. The only ones missing are Kansas and South Dakota, which have been replaced by Illinois and Delaware.
Delaware is the only East Coast state to be in the top 10 list for assault and homicide rates. With the state passing new gun safety legislation in 2022, we’re interested to see how this may affect its standing in the future.23
Meanwhile, the chart below details the top and bottom ten states based on the rates of human trafficking, kidnapping/abduction, and sex offenses. (Again, the numbers are reported as a rate per 10,000 people.)

Created by Innerbody Research
A handful of the most dangerous states also have the highest rates of human trafficking, kidnapping, abduction, and sex offense crimes. New Mexico, Nevada, Kansas, and South Dakota all made the top 10 list, but only the first two also have high rates of assault and homicide. And while Alabama made the top 10 list for assault and homicide crimes, it ranks in the bottom 10 for human trafficking, kidnapping, abduction, and sex offenses.
Similar to the conclusions we discussed earlier, the East Coast has the lowest rates of crimes against persons overall. In contrast, the central U.S. is struggling with human trafficking and other sex offense crimes, while the South has the highest rates of assault and homicide crimes.
Methodology
We analyzed data from the FBI’s Summary Reporting System (SRS) and National Incident-Based Reporting System (NIBRS) reports to rank the most and least dangerous states across the U.S. in terms of crimes committed against individuals. To reach our overall scores, we first calculated the incidence of each crime per 10,000 residents by state, then multiplied each incidence by its weighted value and summed the totals.
Fair use statement
Innerbody Research is committed to providing objective, science-based suggestions and research to help our readers make more informed decisions regarding health and wellness. We invested the time and effort into creating this report to increase the knowledge, safety, and wellbeing of citizens through information about the prevalence and potential causes of violent crime. We hope to reach as many people as possible by making this information widely available. As such, please feel free to share our content for educational, editorial, or discussion purposes. We only ask that you link back to this page and credit the author as Innerbody.com.
Sources
Innerbody uses only high-quality sources, including peer-reviewed studies, to support the facts within our articles. Read our editorial process to learn more about how we fact-check and keep our content accurate, reliable, and trustworthy.
Gramlich, J. (2024). What the data says about crime in the U.S. Pew Research Center.
Gallup. (n.d.). Crime | Gallup Historical Trends. Gallup, Inc.
Gramlich, J. (2021). What we know about the increase in U.S. murders in 2020. Pew Research Center.
President Joseph R. Biden. (2024). Statement from President Biden on Record Decrease in Crime in First Quarter of 2024. The White House.
Pew Research Center. (2024). Cultural Issues and the 2024 Election | Crime, policing, and the 2024 election. Pew Research Center.
Federal Bureau of Investigation. (n.d.). Crime Data Explorer. FBI.
Federal Bureau of Investigation. (2018). Crimes Against Persons, Property, and Society. Uniform Crime Reporting Program, National Incident-Based Reporting System.
Office of the Assistant Secretary for Planning and Evaluation. (2004). Statutory Rape: A Guide to State Laws and Reporting Requirements. ASPE.
Cornell Law School. (n.d.). Statutory rape. Legal Information Institute.
Cornell Law School. (n.d.). Kidnapping. Legal Information Institute.
Cornell Law School. (n.d.). Abduction. Legal Information Institute.
National Conference of State Legislatures. (2023). Self-Defense and ‘Stand Your Ground’. NCSL.
Cornell Law School. (n.d.). Justifiable homicide. Legal Information Institute.
Code of Federal Regulations. (2024). Title 45: Definitions 45 CFR 89.2. National Archives.
Giffords Law Center. (2023). Annual Gun Law Scorecard. Giffords.org.
Washington, T. (2023). Louisiana has 2nd highest U.S. gun death rate. A study blames weak laws, high ownership. WWNO.
Louisiana State Legislature. (2022). Act 680. Louisiana State Government.
The Office of Minnesota Attorney General Keith Ellison. (2022). Attorney General Ellison intervenes in court to regulate ghost guns. The Minnesota Attorney General's Office.
The Office of Governor Gavin Newsom. (2022). Governor Newsom Signs New Measures to Protect Californians from Gun Violence. California State Government.
Akin, K. (2022). New gun rights bills imminent under amended Iowa Constitution. Des Moines Register.
Gramlich, J. (2023). Gun deaths among U.S. children and teens rose 50% in two years. Pew Research Center.
Schaeffer, K. (2024). Key facts about Americans and guns. Pew Research Center.
Governor John Carney. (2022). Governor Carney Signs Package of Gun Safety Legislation. Office of the Governor, Delaware State Government.

Copyright © Innerbody Research 1997 - 2025. All Rights Reserved.
