How to Avoid Stress When Flying This Summer
We analyzed the top 10 airlines in the U.S. to help you avoid travel stressors on your summer getaway.
With many travelers eager to take advantage of the warmer weather and longer days, it's no surprise that the summer months are a prime time for vacationing. But traveling, especially by air, can come with a host of unexpected issues — some of which you may be all too familiar with. Flights can be delayed or canceled, accommodations can be overbooked, and unforeseen expenses can add up in a hurry. Thankfully, there are ways to increase your odds of having an easy, relaxing getaway.
Advanced preparation is a highly effective approach to minimize stress, anxiety, and frustration during your travels. There are several ways to plan ahead, such as purchasing travel insurance, creating a backup plan, or conducting comprehensive research on your travel options (including the airports and airlines you'll be encountering). Our guide provides essential performance information on the top 10 U.S. air carriers, along with insights into the strengths and weaknesses of various airports across the country.
Jump to:
Key takeaways
- JetBlue had the highest percentage of canceled flights (3.85%).
- Delta was found to have the highest rate of on-time arrivals (83.08%).
- American Airlines had the highest percentage of mishandled baggage (0.87%) and the third-highest percentage of mishandled wheelchairs and scooters (2%).
- Portland International Airport (PDX) had the highest rate of on-time departures among U.S. airports (84%).
- Air carrier delay was the most common cause of delayed flights (34%).
Overview
To determine which airlines and airports would be causing travelers the fewest headaches this summer, we analyzed the U.S. Department of Transportation’s (USDOT) Air Travel Consumer Reports from October 2021 to October 2022.1 Published by the Office of Aviation Consumer Protection, these reports provide valuable consumer information about the quality of services offered by most major airlines. In total, we analyzed 6,725,064 flights for the following key metrics:
- Percentage of on-time departures and arrivals by carrier
- Rate of on-time departures by time of day
- Percentage of on-time arrivals and departures by airport
- Rate of canceled flights by carrier
- Common causes of delays by carrier
- Percentage of mishandled baggage, wheelchairs, and scooters by carrier
- Complaints per 100,000 customers by carrier
- Baggage and pet carry-on fees
We evaluated the top 10 major U.S. airlines for each of these metrics, scoring each metric according to a 10-point scale (ten being the highest and one being the lowest), then added up the scores to determine each airline’s overall rank. To further develop our findings on the customer impressions of airport performance, we utilized ChatGPT’s information-gathering capabilities.
Considering a single month of poor performance can significantly impact an airline’s operations, it should be noted that the data aggregated for this article doesn't include the cancellation issues Southwest Airlines experienced in 2022.2 In December of that year, the airline was forced to cancel more than 15,000 flights due to a combination of inclement weather, staffing shortages, and outdated computer systems.

Top 10 U.S. airlines by performance

According to our analysis, Delta Airlines landed in the top spot in terms of operating efficiency. Over the years, Delta has received numerous accolades for its quality of service, including “Best Airline in North America” from the International Air Transport Association (IATA) and “Best U.S. Airline" from Travel + Leisure magazine.3 This efficiency is likely why Delta also had the highest percentage of on-time arrivals (83.08%).
Here’s how the top 10 major U.S. airlines measured up:
- Delta Airlines (83.08%)
- Hawaiian Airlines (79.93%)
- Southwest Airlines (74.13%)
- United Airlines (79.48%)
- Allegiant Air (64.40%)
- Alaska Airlines (77.86%)
- Frontier Airlines (68.52%)
- American Airlines (76.43%)
- Spirit Airlines (74.04%)
- JetBlue Airways (65.77%)
With the highest percentage of canceled flights (3.85%), JetBlue took the last place on our list. Given that JetBlue operates many of its flights out of airports on the East Coast — often susceptible to winter storms, hurricanes, and other weather-related disruptions — many of these cancellations could've been due to weather-related issues. Another common cause of flight cancellations is operational problems, such as technical or maintenance issues and staffing shortages.
Pilot shortages
The need for more pilots has been an ongoing debate between CEOs of several major airlines and the Air Line Pilots Association (ALPA).4 Essentially, the APLA has claimed that airlines are trying to weaken qualification and safety regulations while distracting customers from profit-driven business decisions, like cutting back on services, to fix a problem that doesn’t exist: a shortage of qualified pilots. According to the Federal Aviation Administration (FAA), though, nearly 8,000 pilots were produced in the 12 months between June 2021 and June 2022, exceeding the numbers that have entered the fleet in previous years.
Fees, baggage, and complaints
Just two spots above JetBlue on our list, American Airlines had the highest rate of mishandled baggage (0.87%) and the third-highest percentage of mishandled wheelchairs and scooters (2%). But this still didn’t earn AA the highest number of complaints; Frontier Airlines took that honor with 14.3 complaints per 100,000 customers.
Not only did Frontier have the second highest percentage of flight cancellations (2.39%), but many of their customers have expressed that the airline doesn't handle these situations well or communicate effectively about scheduling issues. Customer complaints directed at Frontier have also been due to:5
- Long telephone hold times
- Unhelpful or unfriendly staff
- Difficulty resolving issues
- Uncomfortable seating
Known for their low fares, Frontier has also been criticized for having a less-than-transparent fee structure, often charging extra for services other airlines might include for free, such as checked baggage, seat selection, and even carry-on bags.
In comparison, Southwest Airlines — third place on our list — had the lowest number of customer complaints (1.26 per 100,000 customers). This could be attributed to their customer-focused approach, high levels of employee engagement and transparency, and incredible past safety record.6 Southwest also had a relatively low flight cancellation rate in 2022 (2.06%), and it appears to be the only airline not to charge for checked bags. As mentioned, Southwest’s impressive performance depicted here does not take into account the December 2022 cancellation debacle. The data and comparisons here underscore just how stunning Decembers meltdown was.
For those traveling with pets, Allegiant Airlines looks like your best choice. Five of the ten airlines we analyzed charged $125 (Hawaiian, United, American, Spirit, and JetBlue), but Allegiant will let your furry friend fly along for just $50.
And for those traveling with a wheelchair or scooter, it might be best to avoid JetBlue and Spirit Airlines, as they had the highest percentage of mishandling these mobility devices (5.11% and 5.6%, respectively).
Best and worst airports by rate of on-time departure

Portland International Airport (PDX) is known for its convenience, accessibility, and commitment to customer service and efficiency. On top of that, PDX has claimed the highest percentage of on-time departures among U.S. airports (84%). In contrast, Chicago Midway International Airport (MDW) had the lowest rate of on-time departures (62.9%), attributed to long wait times, a confusing layout, and poor customer service.7
Also offering lackluster performances were two of Florida’s main airports: Fort Lauderdale-Hollywood International Airport (FLL) and Miami International Airport (MIA). In addition to their low on-time departure rates (72.4% and 72.6%, respectively), both of these airports have reputations for being busy and congested, with limited amenities and facilities.
Running on time
Four of the top 10 airports for on-time departures are on the West Coast:
- Portland International Airport (PDX): 84%
- San Francisco International Airport (SFO): 81.7%
- Seattle-Tacoma International Airport (SEA): 81.2%
- San Diego International Airport (SAN): 80.8%
Compared to other parts of the country, the West Coast tends to have milder weather conditions and fewer extreme weather events, like blizzards or thunderstorms, making favorable weather conditions a potential contributor to the impressive performance of their airports.8
Additionally, many West Coast airports are strategically located near major population centers and business hubs, allowing airlines to better manage flight schedules. More modern technology and efficient operations also help minimize delays; for example, SFO (San Francisco International Airport) has invested in runway technology (ASDE-X Taxiway Arrival Prediction) that allows for safer landings.9 14
SFO is also one of the busiest airports in the world in terms of passenger traffic, accommodating an average of 3.15 million travelers every month.10 This high volume has prompted significant investments in infrastructure, technology, and amenities, many aimed at ensuring an efficient and comfortable passenger experience.
Common causes of delayed flights
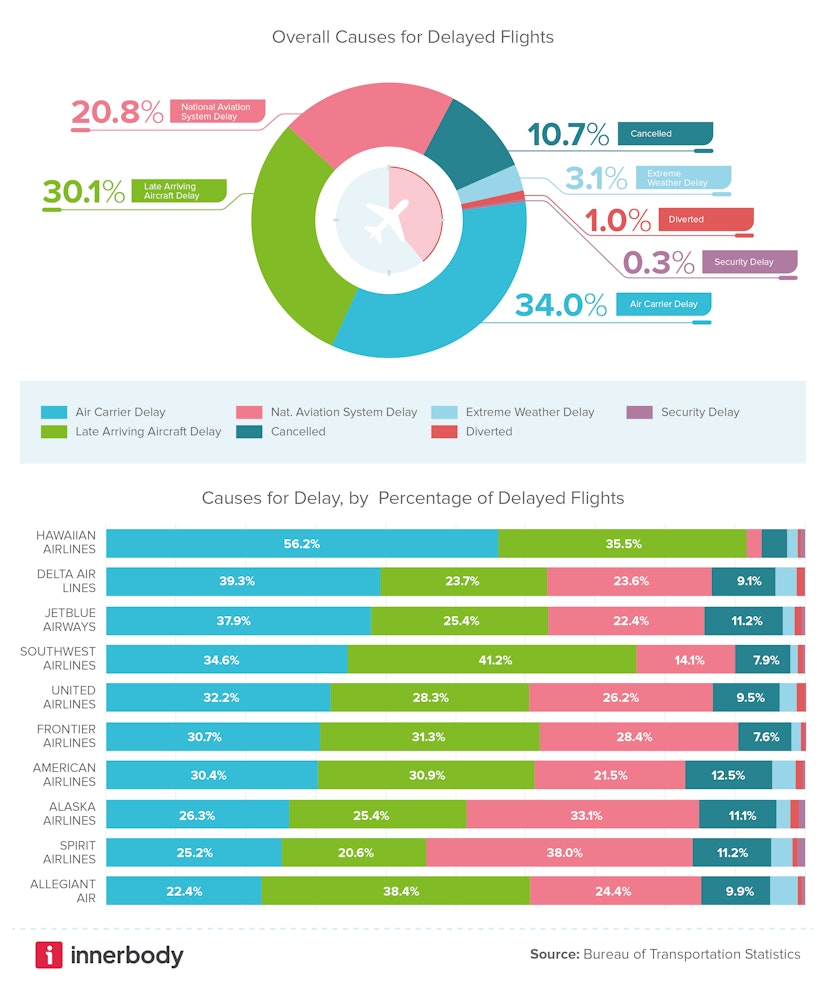
According to USDOT’s reports, air carrier delay (34%) was the most common cause of delayed flights, followed by late-arriving aircraft (30.1%). These delays can be due to a range of factors, such as weather, air traffic control instructions, mechanical issues, staffing problems, and tarmac traffic.
The most common causes of delayed flights are:
- Air carrier delay (34%)
- Late-arriving aircraft (30.1%)
- National Aviation System delay (20.8%)
- Canceled flight (10.7%)
- Extreme weather (3.1%)
- Diverted flight (1%)
- Security delay (0.3%)
Certain airlines also appear to be more affected by different types of delays:
- Air carrier delay; Hawaiian airlines (56.2%)
- Late-arriving aircraft; Southwest airlines (41.2%)
- National Aviation System delay; Spirit airlines (38%)
- Canceled flights; American Airlines (12.5%)
Flight cancellations and delays can be a huge hassle, but there are ways to stay ahead of these issues.11 Keeping an eye on the weather forecast for both your city of departure and destination is an excellent place to start. Additionally, you can review the Bureau of Transportation Statistics (BTS) monthly report to stay up-to-date on airline on-time statistics and delay causes.12 Tracking your plane’s inbound status via apps from the airline or a third party can also help you stay ahead of any obstacles.
Best times to fly to avoid delays
Between 6 a.m. and 7 a.m. appears to be your best bet for an on-time departure (88.4%). It’s only after 11 a.m. that the percentage of on-time departures slips below 80%. There are several reasons why early morning flights are more likely to depart on schedule:
- Less air traffic congestion in the early morning results in fewer delays compared to later in the day when air traffic is generally higher.
- Early morning flights are less likely to be impacted by weather-related delays, as weather-related delays occur more frequently in the afternoon and evening.
- Flights leaving early in the day are more likely to depart on time because the aircraft and crew are typically already at the airport from the previous night's flight, minimizing the likelihood of delays due to unexpected maintenance or crew scheduling issues.
You’re less likely to depart on time if you leave anytime between 1 p.m. and 10 p.m., given that afternoon and evening flights see more delays due to runway traffic and weather issues. Aircraft maintenance also typically occurs during midday hours. Early morning flights are regularly much less expensive, as well.13
Methodology
We analyzed Air Travel Consumer Reports from October 2021 to October 2022 (a total of 6,725,064 flights) to determine which airlines would cause people the fewest headaches this summer. Some of the metrics we included in our overall evaluation were: percentage of on-time arrivals and departures by air carrier, rate of on-time arrivals and departures by airport, the percentage of flight cancellations by air carrier, and the most common causes for delayed flights. Each metric was scored according to a 10-point scale (ten being the highest and one being the lowest), then we calculated the scores to determine each airline’s overall rank.
Fair use statement
Innerbody Research is committed to providing objective, science-based suggestions and research to help our readers make more informed decisions regarding health and wellness. We have invested time and effort in creating this report to provide a comprehensive guide for summer air travel and to help travelers avoid unnecessary stress caused by unexpected complications and delays associated with major air carriers and airports. We hope to reach as many people as possible by making this information widely available. As such, please feel free to share our content for educational, editorial, or discussion purposes. We only ask that you link back to this page and credit the author as Innerbody.com.
Sources
Innerbody uses only high-quality sources, including peer-reviewed studies, to support the facts within our articles. Read our editorial process to learn more about how we fact-check and keep our content accurate, reliable, and trustworthy.
U.S. Department of Transportation. (2023). Air Travel Consumer Reports: 2023. U.S. Department of Transportation. Retrieved March 27, 2023.
Stiles, M., & Hickey, C. (2022). How Southwest Failed the Holidays: Four Charts Explaining the Cancellations. CNN. Retrieved March 27, 2023.
Delta Airlines. (n.d.). Delta: America's Most-awarded Airline. Delta News Hub. Retrieved March 27, 2023.
ALPA. (2022). ALPA Releases Data Showing Nearly 8,000 New Pilots Produced in Past 12 Months. Air Line Pilots Association. Retrieved March 28, 2023.
Better Business Bureau. (n.d.). Frontier Airlines, Inc. - Complaints: Better Business Bureau Profile. Better Business Bureau. Retrieved March 28, 2023.
Chandler, J. G. (2014). Southwest's Amazing Safety Record. Airline Ratings. Retrieved March 28, 2023.
Lazare, L. (2019). Chicago Midway Airport's 'worst' ranking sparks controversy. Chicago Business Journal. Retrieved April 6, 2023.
Gilbertson, D. (2023). The Best and Worst Airports of 2022. The Wall Street Journal. Retrieved March 28, 2023.
Fitzpatrick, A. (2023). Safer landings at San Francisco International Airport. Axios San Francisco. Retrieved April 6, 2023.
Visit California. (2023). California Airport Passenger Traffic by Month. Visit California. Retrieved March 28, 2023.
Waldek, S. (2022). You Can Find Out If Your Flight Will Be Delayed Before It's Even Announced — Here's How. Travel + Leisure. Retrieved March 28, 2023.
Bureau of Transportation Statistics. (n.d.). BTS: Airline On-Time Statistics and Delay Causes. Bureau of Transportation Statistics. Retrieved March 28, 2023.
Bologna, C. (2023). The Best Time of Day to Fly Right Now. HuffPost. Retrieved March 28, 2023.
Federal Aviation Administration. (2023). Runway Safety. FAA. Retrieved April 6, 2023.

Copyright © Innerbody Research 1997 - 2025. All Rights Reserved.
